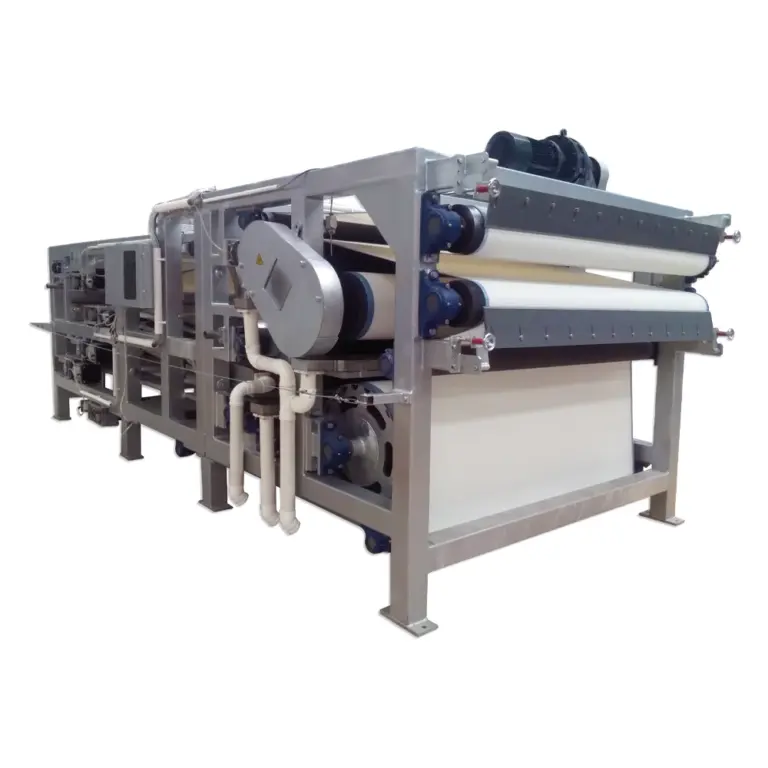
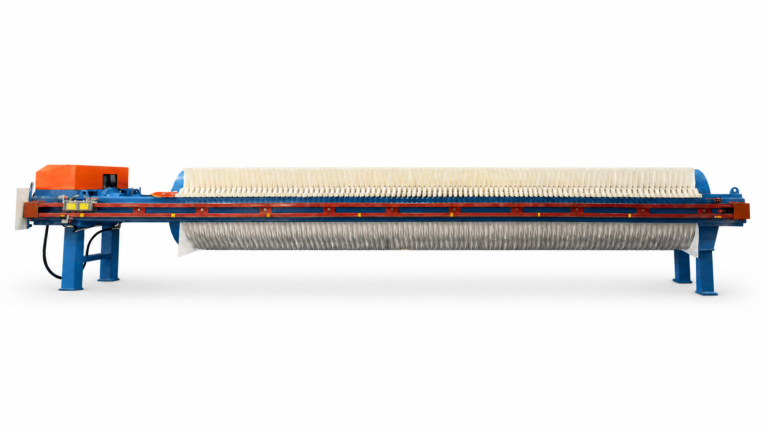
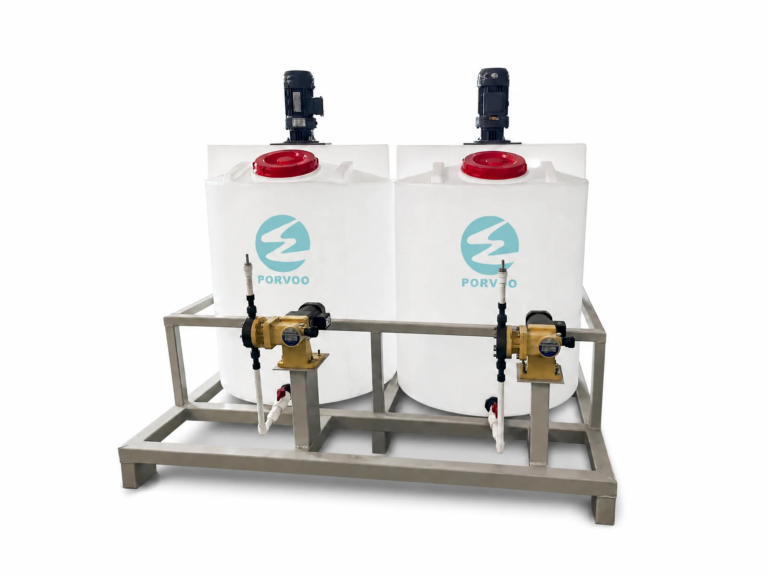
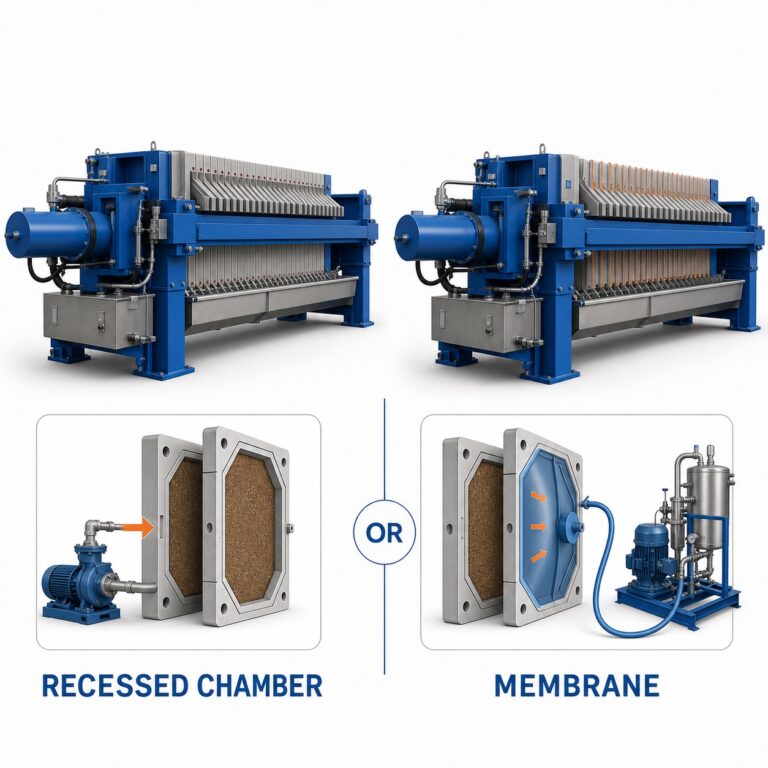
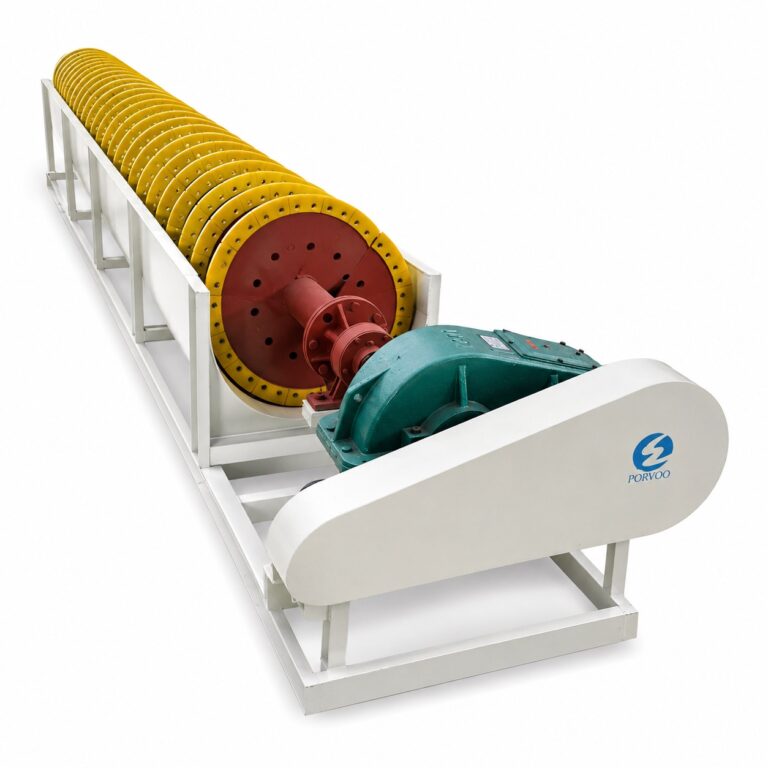
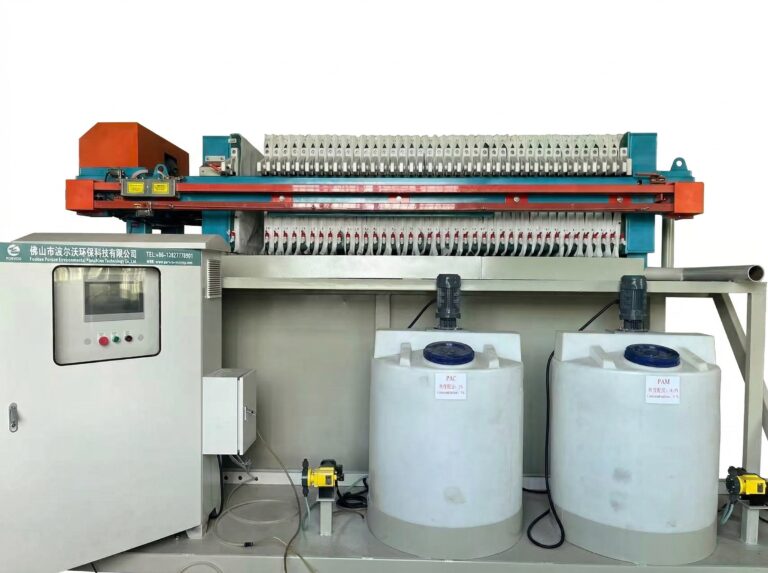
Belt press total cost is the sum of polymer, wash water, operator time, belt replacement and the haulage of wet cake, measured per tonne of incoming dry solids at a defined capture rate and operating schedule. On most industrial sludges, polymer and hauling dominate the recurring bill, and they tend to move against each other: a dose that improves flocculation usually produces a drier cake and a lighter truck, while a cheaper dose leaves water in the cake that the hauler bills for. The variables that decide which option is cheaper are the sludge’s dry-solids concentration and conditioning behavior, the achievable cake dry-solids fraction, the hauler’s pricing basis (wet mass or per load), the water source and return path for belt washing, and the shift pattern that determines paid labor.
Set a Common Cost Basis for the Same Sludge Duty
A belt press comparison only means something when both options are costed against the same incoming dry-solids duty, the same operating schedule and the same minimum capture requirement. Quotes rarely arrive that way. One supplier reports throughput in cubic meters per hour of feed, another in dry kilograms per hour, a third assumes a two-shift day while the plant runs one. Convert everything to cost per tonne of incoming dry solids before any number is compared.
The reason for insisting on dry solids rather than wet feed is simple: cost per wet tonne of feed changes with dilution. A thickener running slightly thinner makes the same press look better on a wet-tonne basis while handling less actual solids. Dry-solids loading is the duty the press is actually doing, and it is the denominator that both polymer dose and cake production attach to.
Capture matters just as much as throughput. A press running at a low polymer dose or a high belt speed can show an attractive consumable bill while sending solids back to the clarifier or thickener in the filtrate. Those solids return to the front of the plant and are dewatered again, so the apparent saving is a recirculating load that someone else pays for. Fix a minimum capture requirement, a cake dry-solids target and a filtrate clarity criterion before the trial, and discard any run that misses them rather than averaging it into the result. The US EPA belt filter press fact sheet, which addresses municipal biosolids practice, describes how polymer conditioning, dry-solids loading and feed variability interact on a belt press; the principle carries to industrial sludges, but consumption and cost figures have to come from the plant’s own trial data.
Feed variability deserves one line in the cost basis. If the sludge changes with production campaign, season or upstream chemistry, the trial should cover the range the press will actually see, or the comparison should name which feed condition it represents.
Meter Polymer and Wash Water
Polymer is the variable that most often decides a belt press comparison, and it has to be recorded as purchased product, active fraction and consumption per tonne of dry feed solids. A quoted dose of so many grams per kilogram is meaningless until the active polymer content of the product is known, because one supplier’s 40 percent emulsion and another’s dry powder are not the same purchase. Record what is actually bought, what fraction of it is active, how much was consumed over the metered run, and the price on the basis that matches. The cheapest drum price loses its advantage quickly if the product needs a higher dose or delivers a wetter cake.
Each dose has to be judged against the same three results: cake dry solids, filtrate clarity and throughput. A dose comparison that reports only consumption tells you which run used less chemical, not which run cost less. Where polymer turns out to be the largest variable line, the mixing and ageing setup is worth examining before alternative conditioning chemistries are trialled, because activation quality changes the dose a product needs as much as the product choice does.
Wash water is the quieter line. Belt washing runs more or less continuously during production and again during cleanup, so meter the volume over the same run that the polymer was metered on, and include the washing that happens outside steady production. Record the source and the return destination as well as the volume: purchased mains water, recycled process water and clarifier overflow are not interchangeable in cost terms, and returning dirty washwater to a treatment step moves a solids load and a pumping duty back upstream.
Price the water and the incremental handling it creates. Reuse can cut the purchased-water line to near zero while leaving pumping energy, a returned solids load and a treatment burden that still belong in the comparison. Where washwater treatment already sits inside a shared plant charge that both options pay regardless, count only the incremental cost that the charge does not already cover, and say in the worksheet that this is what has been done.
Count Operator Time and Belt Replacements
A supplier’s staffing estimate usually describes the steady run, and the steady run is not where belt press labor goes. Time a representative shift and record startup, polymer make-up and ageing, routine operating checks, belt tracking and spray-bar interventions, blinding or plugging responses, and end-of-run cleanup and washdown. Price the actual person-hours across every shift the press runs, and list contracted work such as deep cleaning or specialist servicing as a separate line rather than folding it into the operator rate.
The differences that matter are often small in minutes and large in cost. A daily washdown that takes an extra thirty minutes, or an intervention that cannot be done safely by one person, changes paid labor materially even when two presses run at identical feed rates. Two-person tasks are worth flagging explicitly in the observation sheet, because they double the hourly cost of an activity that looks minor on a task list.
Belt cost is almost always quoted as a replacement set, and a set price on its own understates the line. Budget the set and the fitting labor, and then test the estimate against a shorter replacement interval using the plant’s own belt history, or a clearly labeled assumption where no history exists. Belt life on an abrasive mineral or ceramic sludge is driven by the solids themselves, so a figure borrowed from another duty is a placeholder, not a forecast.
Two allowances sit alongside the set price and should be kept separate from it. The first is the production impact of a change: hours the press is down, and whether the plant can absorb them in a scheduled window or has to stop feed. The second is stock held on site, since a plant that cannot wait for delivery carries a spare set as working capital. Where a supplier quotes an installed set with fitting included, do not add fitting labor twice — take it out of the plant’s own line and note why.
Convert Cake Solids Into Haulage Cost
Haulage cost follows the cake dry-solids fraction, because the truck carries water as well as solids. Where the receiver charges by wet mass and capture is comparable between the options being compared, divide the captured dry-solids mass by the measured dry-solids fraction in the cake to estimate the billed wet mass, then price that mass using the actual transport and receiving terms. The arithmetic is trivial; the discipline is in using a measured cake solids fraction from the trial rather than a datasheet range.
The consequence is worth stating plainly. At the same captured solids mass, a lower cake solids fraction means more water leaves the site in the truck, and the plant pays freight and gate fees on that water every load. This is the reason a higher polymer dose can be the cheaper option, and the reason a press that produces a marginally drier cake can justify a higher consumable bill on a high-tonnage duty.
Where freight is charged per load rather than per tonne, the wet-mass conversion is only the first step. Model the number of trips at the actual payload the vehicle achieves, which may be limited by volume rather than mass for a bulky cake, and apply any minimum charge per load or per collection. A drier cake that does not reduce the trip count delivers less saving than the tonne arithmetic suggests, and a wetter cake that pushes the load into an extra trip costs more than it suggests.
Record the receiver’s terms alongside the measurement: pricing basis, any moisture-related surcharge or rejection condition, and the acceptance criteria that apply to the material. Whether a given cake is acceptable for a particular disposal or reuse route is decided by the receiving facility and the plant’s approved waste handling procedure, not by the dewatering comparison.
Compare Total Cost When Inputs Move in Opposite Directions
| Cost item | Record for each option | Calculate over the same period |
|---|---|---|
| Polymer | Purchased product, active fraction, trial dose per tonne of incoming dry solids and unit price | Product quantity at the trial dose and common solids duty, priced on the matching basis |
| Wash water | Wash volume during production and cleanup, source and return destination | Purchased water plus incremental return pumping or treatment |
| Labor | Person-hours for startup, checks, interventions and cleanup, plus contracted work | Person-hours by shift at the applicable rate, plus separately priced services |
| Belts | Set price, fitting scope and replacement interval based on plant history or an assumption | Sets needed over the study period, fitting outside the quote and production impact |
| Hauling and receiving | Captured solids, measured cake solids fraction and hauler or receiver terms | Wet mass charged or trips at actual payload, plus applicable receiving charges |
The comparison resolves only when every changed line is added together over the same study period, because belt press inputs routinely move in opposite directions. A conditioning change that raises polymer and washwater cost but produces a drier cake is worth accepting on cost grounds only when the reduction in haulage and receiving charges exceeds the increase, after labor, belts and any other cost that moved, with feed duty and capture held the same in both cases. Improving one input, or one cake result, in isolation is how a plant ends up paying more overall.
Build the comparison as a single worksheet that records, for each option, what was measured and what it costs across the period: the polymer product and dose, the wash volume and its source and return, the person-hours by shift plus contracted services, the belt sets and fitting scope at the assumed replacement interval, and the captured solids with the measured cake solids fraction and the hauler’s terms. Keeping the measured basis next to the priced result makes it obvious when two options are being compared on different assumptions.
Where the decision also involves buying or replacing a press rather than only changing how an existing one is run, the recurring lines are not enough on their own. Add installed cost, energy, planned repairs, the downtime those repairs create, and any end-of-period value, and compare both options across one common study period. The NIST Life-Cycle Costing Manual, a federal facility methodology, sets out how to separate initial, recurring and one-time costs and compare alternatives over a common study period with sensitivity analysis; it supplies the structure, not the equipment prices or financial assumptions, which come from the quotes and the plant’s own finance inputs.
Vary the least certain costs rather than presenting a single total. Belt life, haulage rate and polymer dose are usually the three inputs least firmly known at decision time, and a result that reverses when any one of them moves within a plausible range is a result that needs more trial data before it is signed off. A low first-year operating bill reverses easily once an overhaul falls due or a receiving gate fee rises.
For a useful supplier discussion, have the following ready: the sludge’s dry-solids concentration and its variability across production campaigns, the dry-solids tonnage per day and the shift pattern it runs on, the polymer product and dose currently used with its active fraction, metered wash volumes and the water source and return path, the measured cake dry-solids fraction and the required capture, and the hauler’s pricing basis with current rates. With those in hand, a supplier can quote against the plant’s actual duty instead of a generic throughput, and the resulting numbers can be dropped straight into the worksheet.
Frequently Asked Questions
Q: Should I count fewer operator hours as cash savings?
A: Count them as cash savings where they remove a real expense such as overtime or contracted coverage. If the same crew stays on payroll, report the time available for other work separately and state whether that time can be reassigned.
Q: Will a drier cake reduce my bill if my hauler charges by the truckload?
A: It will reduce the transport bill if the change avoids billed trips or changes the contract charge. Start with actual loaded weights and pickup records to see whether the lighter cake would let you skip a collection or still require the same schedule.
Q: How can I compare the quotes if I am still waiting for a disposal price?
A: Calculate the difference in cost before hauling and receiving, then find the rate at which the projected difference in billed cake mass would offset it. Compare that break-even rate with the quotes when they arrive. Use trips instead of tonnes if that is the proposed billing basis.
Q: Can I scale a short trial’s wash water and labor straight up to an annual budget?
A: Separate the running use from time and water spent each time the press starts, stops or is cleaned. Scale the first part by expected press hours and the second by the plant’s actual shift and cleaning schedule.