How many dewatering units does a project actually need? The question seems straightforward until feed grade shifts, filter media foul faster than expected, or a single unit comes offline for cleaning — and production is still generating concentrate that needs somewhere to go. Sizing the dewatering stage around a single average flow rate answers the wrong question; the real sizing problem is how much dry-solids throughput the system can sustain across the full range of conditions the feed will actually present, and for how many hours a day it can keep doing so.
Start With Dry-Solids Demand and the Feed Variability Envelope
Dewatering capacity is fundamentally a dry-solids throughput requirement, not a liquid-volume requirement. Slurry volume varies with dilution, process water addition, and upstream separation efficiency, while the mass of solids that must leave the circuit as cake is set by the production rate and the concentrate grade the upstream process delivers. Sizing from an average daily slurry volume alone can understate the demand during periods when the same solids mass arrives in a smaller volume of denser slurry, or overstate it during periods of dilute, low-grade feed. The dry-solids figure is the stable reference point; volume is a downstream consequence of it.
The feed variability envelope matters because concentrate dewatering equipment responds differently to feed characteristics than the upstream separation stage does. Where feed solids concentration, particle size distribution, or mineralogy shift across a production cycle, filtration rate and cake formation behavior shift with them, even when the dry-solids mass stays constant. A feed case that produces a fast-draining, structurally stable cake places a very different demand on filter area and cycle time than a feed case that produces a slow-draining or compressible cake, even if both deliver the same tonnage of dry solids per day. Defining the operating envelope means identifying which feed cases are expected to occur, not only the long-run average case, and understanding that the governing design case may be a lower-frequency but harder-to-dewater condition rather than the typical one.
This has a direct consequence for how a project states its design basis. A dry-solids demand figure attached to a single “typical” feed case leaves the equipment selection exposed whenever the feed departs from that case. A dry-solids demand figure attached to a stated range of feed cases, each with its own expected dewatering behavior, gives a supplier enough information to check whether a given filter technology and area can cover the full envelope or only the typical point within it. The buyer’s task at this stage is to define the boundaries of that envelope — the highest-tonnage case, the hardest-to-dewater case, and whether those two can occur simultaneously — before any technology-specific capacity conversion begins.
Convert Testwork Into Technology-Specific Productive Capacity
Representative testwork establishes how a given feed behaves under filtration, but a laboratory or pilot result does not transfer directly into installed capacity without a scale-up step that is specific to the filter technology under consideration. A vacuum filter, a pressure filter, and a ceramic membrane-type filter each impose a different driving force, cycle structure, and cake-formation mechanism on the same feed, so a filtration rate measured under one technology’s conditions does not predict the productive capacity of a different technology without re-testing or a documented conversion basis.
The scale-up step itself carries assumptions that the buyer should be able to see, not only the converted number. Testwork run on a small filter area, over a short duration, or under conditions that do not reproduce full-scale cake thickness, compression, or temperature can produce a flux or filtration-rate figure that does not hold once the filter is sized to industrial area and run for the duration a production shift requires. Where testwork duration is short relative to the planned operating cycle, the result may not capture the decline in filtration rate that occurs as cake resistance builds over a longer run, or the effect of repeated cleaning cycles on long-term performance. GB/T 30177.2-2024, the national standard covering performance testing methods for vacuum filters, establishes the kind of source identity and scope relevant to this step: it exists as a recognized basis for structuring vacuum-filter performance testing, though its detailed clauses, thresholds, and pass criteria are not transferable here without a project-specific test report referencing it.
The practical consequence is that a stated productive capacity figure is only as reliable as the visibility of its scale-up path. A buyer reviewing a supplier’s capacity claim should be able to trace the figure back to the representative feed case it was derived from, the filter technology under which the test was run, the test duration and area relative to the proposed full-scale unit, and any correction factors applied to bridge the two. Where that path is not visible, the number functions as a target rather than a verified capacity, and the gap matters most for feed cases near the edge of the variability envelope, where scale-up assumptions are least likely to hold.
Account for Batch Cycle Steps and Continuous-Filter Interruptions
| Duty pattern | Capacity treatment | Availability inputs to include | Límite de decisión |
|---|---|---|---|
| Batch duty | Calculate productive capacity across the complete modeled cycle | Cycle steps, cleaning, cake discharge, and maintenance | The result applies to the stated cycle, testwork, and availability assumptions |
| Continuous duty | Calculate productive capacity after defined continuous-filter interruptions | Interruptions, cleaning, cake discharge, and maintenance | The result applies to the stated testwork, interruption, and availability assumptions |
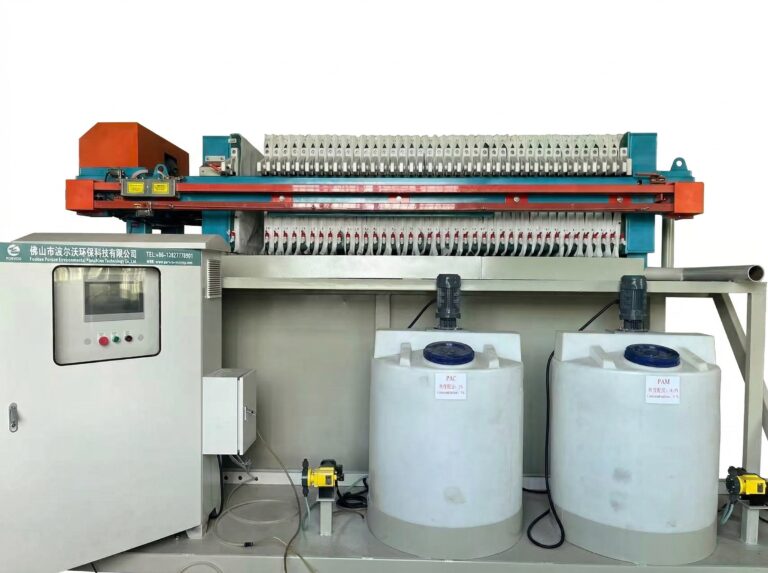
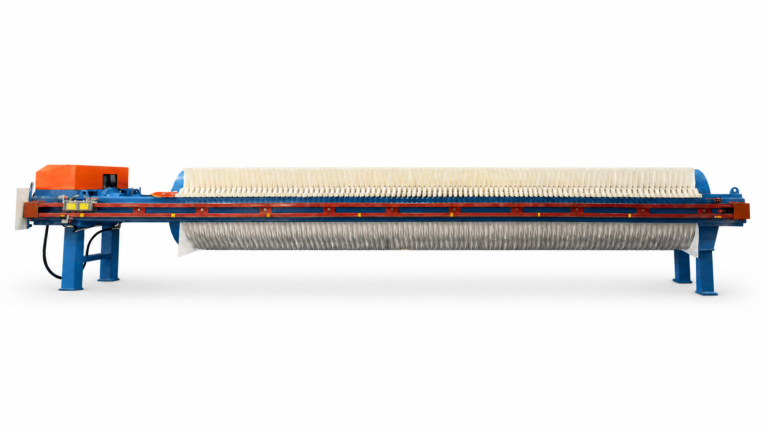
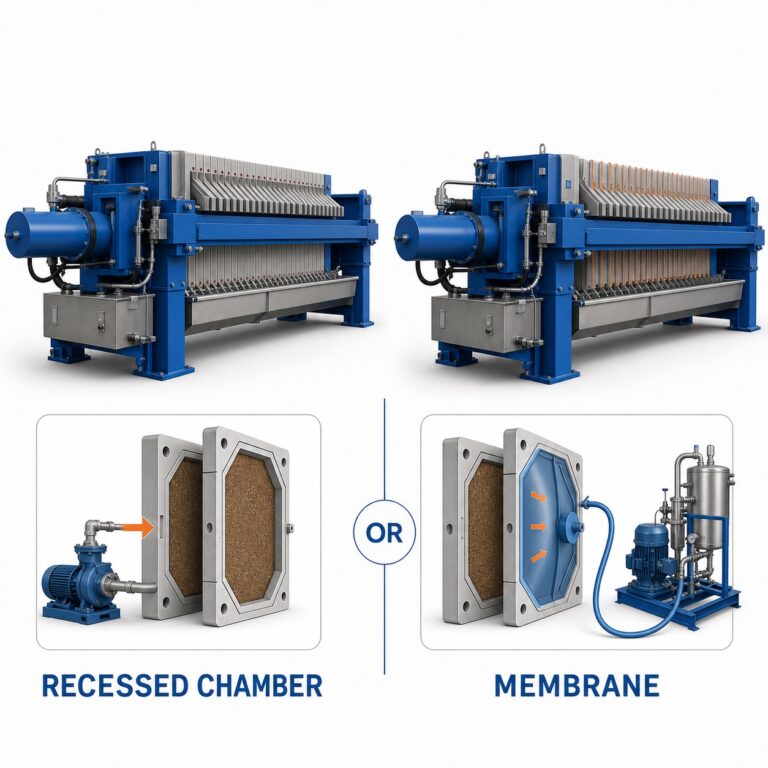
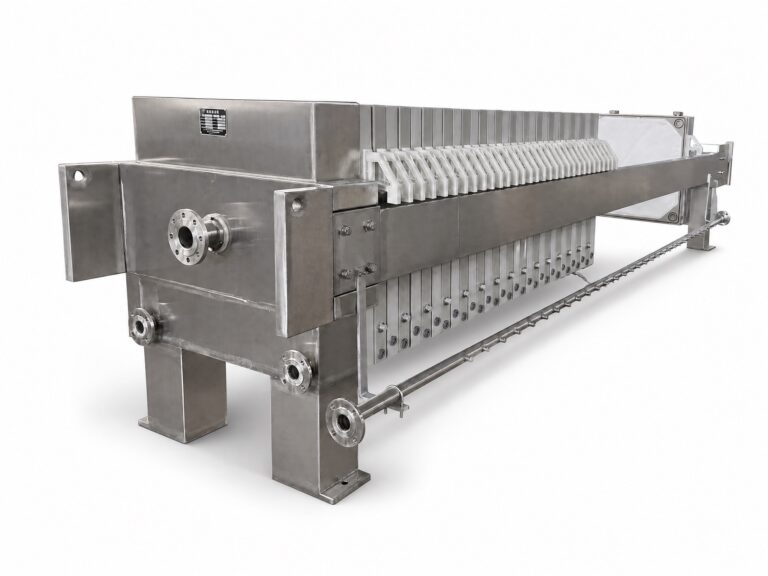
Productive capacity is not the same as filtration rate, because filtration rate describes performance only during the portion of a cycle when solids are actively being captured and formed into cake. A batch-type filter, such as a filter press operating on a recessed-plate or similar cycle, spends part of every cycle on steps that do not add dry-solids throughput: closing and sealing the filter, feeding and building the cake, and then opening the unit to release it. The Ficha informativa de la EPA sobre tecnología de biosólidos: prensas de filtro de placas empotradas describes this batch cycle interface in general terms, establishing that cycle structure and representative testing are relevant considerations for this filter type, without providing numeric cycle times or cake results that would transfer to a specific mineral processing application.
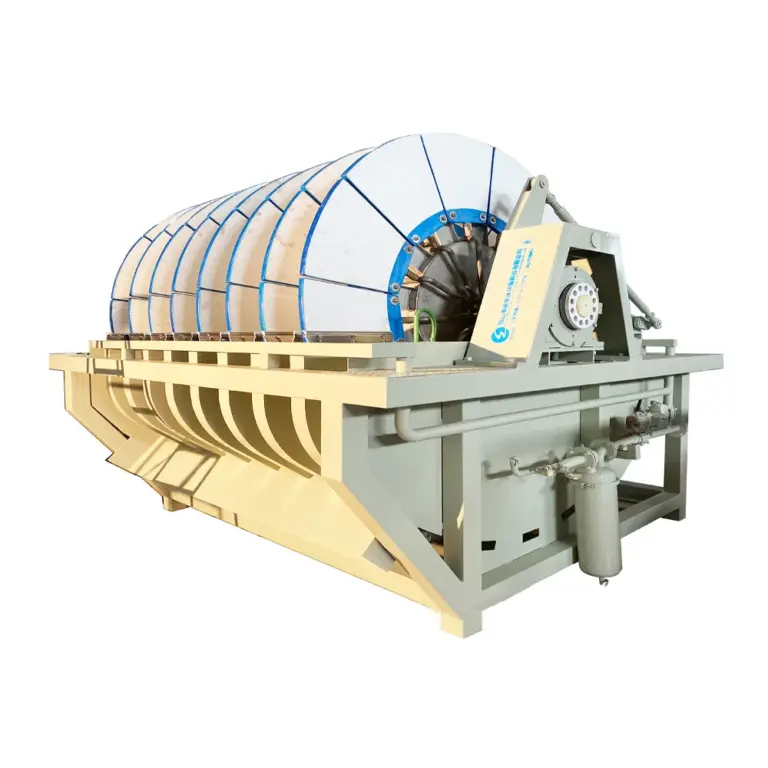
A continuous-type filter, such as a vacuum disk or drum filter, does not have the same discrete batch structure, but it is not available for filtration during its entire operating period either. Interruptions tied to the filter’s own operating cycle — intervals where the mechanism required to maintain continuous operation is not actively producing filtrate — reduce the time available for productive throughput in a way that parallels, without duplicating, the batch filter’s non-productive cycle steps.
The consequence for sizing is that a filter’s rated filtration rate must be converted into productive capacity by applying the fraction of total cycle time that is actually available for solids capture, and that fraction differs by technology and by how the cycle is configured for a given feed. A feed that cakes quickly may allow a shorter cycle and a higher number of cycles per period, raising productive capacity relative to filtration rate alone; a feed requiring a longer cake-formation step reduces that ratio. Where a project compares batch and continuous technologies for the same duty, the comparison is only meaningful when both figures are stated as productive capacity under a fully modeled cycle, not as raw filtration rate, since the non-productive fraction of the cycle can differ enough between the two to change which technology delivers more dry-solids throughput per day for the same installed filter area.
Model Planned Cleaning, Cake Discharge, and Maintenance Availability
Cycle-level accounting establishes productive capacity within an operating period, but the filter is not available for that cycle during every hour of the day or every day of the year. Planned cleaning restores filtration performance as media or membrane surfaces lose permeability through use, and the frequency and duration required depend on feed characteristics such as fine-particle content, scaling tendency, or chemical interaction with the filter medium. Cake discharge, whether automated or requiring manual intervention, adds non-filtering time at the end of each cycle or each operating run, and the time this takes depends on cake handling characteristics and the discharge mechanism built into the equipment. Maintenance — covering wear items, seals, drive components, or membrane elements depending on the technology — removes the unit from service for intervals that are planned but still subtract from total available operating time.
Each of these inputs behaves differently depending on feed severity. Where the feed envelope includes cases with higher fine-particle content or greater scaling tendency, cleaning frequency can increase relative to a cleaner feed case, which lowers the hours per day genuinely available for filtration even though the equipment’s rated filtration rate has not changed. Where cake characteristics vary across the feed envelope, discharge time can vary correspondingly, meaning the same filter may deliver different productive capacity under its easiest and hardest feed cases even before accounting for filtration rate differences.
The planning consequence is that availability should be modeled explicitly as a percentage of calendar time, built from the same feed envelope used earlier, rather than assumed as a fixed industry figure. A buyer defining the operating envelope has already identified which feed cases drive harder cleaning or discharge demands; that same information should feed directly into an availability estimate, so the productive capacity figure a supplier offers reflects the hours the filter will actually be filtering, not the hours it is simply installed and connected.
Compare Redundancy and Buffering Against Lost-Production Consequences
| Continuity measure | Capacity question | Límite de decisión |
|---|---|---|
| Installed redundancy | How much productive duty remains during a dewatering outage? | Fix the equipment count only after the remaining duty is compared with the defined lost-production consequence |
| Buffer storage | How much feed can be held during the interruption? | Treat storage as project-specific coverage and compare it with the outage consequence before fixing equipment count |
Once productive capacity per unit is established under a realistic availability assumption, the remaining question is how many units the project needs — and that question cannot be answered from capacity alone. It depends on what happens to upstream production when the dewatering stage is unavailable, whether through planned maintenance, cleaning, or an unplanned interruption.
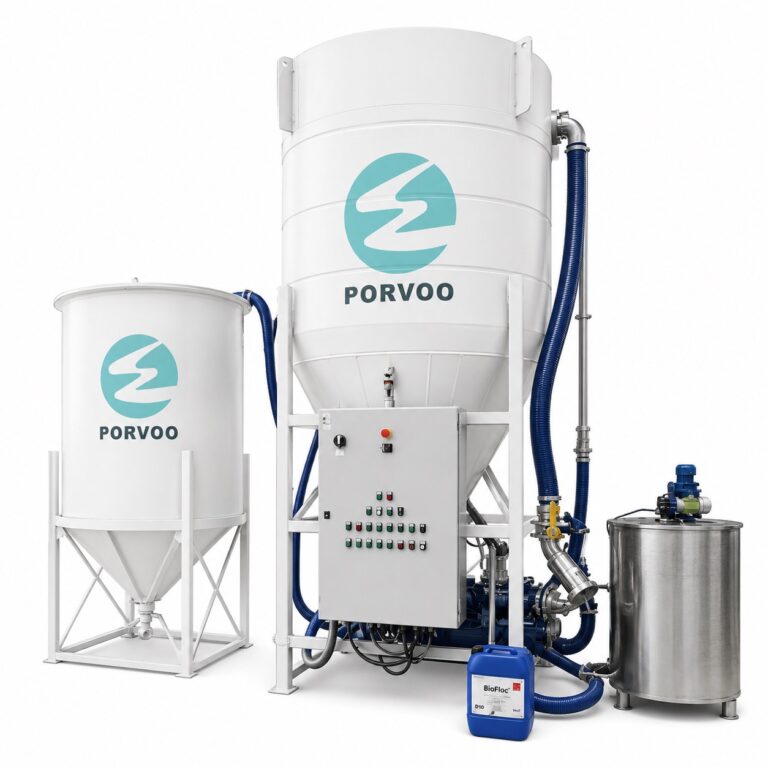
Installed redundancy, meaning an additional unit beyond the number strictly required to meet average dry-solids demand, keeps a defined fraction of total productive duty available even while one unit is out of service. Buffer storage, meaning capacity to hold feed concentrate during an interruption, takes a different approach: rather than keeping dewatering duty available, it keeps the upstream process running by giving it somewhere to send material until the dewatering stage returns to service. Each measure protects against a different consequence. Redundancy protects continuous dewatering throughput directly; buffering protects upstream production continuity for the duration the buffer can hold, after which the same throughput question returns.
Where the consequence of a dewatering outage is that upstream production must also stop, the project has a strong reason to examine redundancy, since buffering only defers the production impact rather than removing it. Where upstream production can be slowed, diverted, or temporarily stored without consequence, buffer storage may cover the interruption without adding a full redundant unit. Neither path is inherently preferable; the choice depends on the production consequence the project is protecting against, the duration of the interruptions the availability modeling has already identified, and the cost and footprint implications of each option relative to that consequence — information that sits with the project team, not with the equipment specification alone.
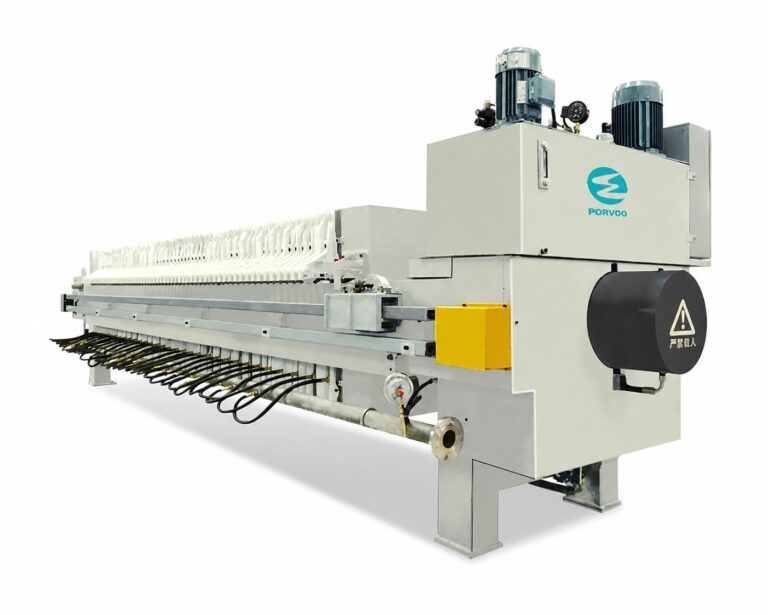
Information supplied at this stage — the modeled availability, the identified interruption durations, and the production consequence of an outage — is what allows a capacity and configuration review to move from a single-unit filtration rate figure to an actual equipment count. A review of Porvoo’s filtration equipment, including filtros de disco cerámicos al vacío y industrial filter presses, depends on this information being stated explicitly rather than assumed, since the same productive capacity per unit can support very different equipment counts depending on how the project weighs redundancy against buffering.
Document Sizing Assumptions for Supplier Verification
| Assumption to record | Documented basis | Supplier verification |
|---|---|---|
| Design duty | Dry-solids demand | Confirm that equipment sizing uses the stated dry-solids demand rather than average slurry volume alone |
| Base de la ración | Defined variability envelope and representative feed cases | Confirm which cases govern the offered capacity |
| Testwork conversion | Representative testwork, selected filter technology, and visible scale-up assumptions | Confirm how test results become productive capacity for the offered technology |
| Operating duty | Batch cycle steps or continuous-filter interruption basis | Confirm which time elements are included in the capacity calculation |
| Planned availability | Cleaning, cake discharge, and maintenance inputs | Confirm how each input affects the stated productive availability |
| Continuity basis | Installed redundancy or buffer storage compared with the production consequence of an outage | Confirm how the offered equipment count addresses that consequence |
The sizing basis built through the preceding steps is only useful to a supplier if it is documented in a form that can be checked against an equipment offer. A dry-solids demand figure, a feed variability envelope, a testwork-to-capacity conversion, a stated operating duty, a set of availability inputs, and a continuity decision each represent a judgment the project has already made; submitting them as a written basis, rather than leaving them implicit in a target production figure, is what allows a supplier’s quotation to be checked against the same assumptions the project used rather than a different, unstated set.
This is also where the practical limits of comparing feed-related conditions across projects become relevant. A testwork result, a scale-up conversion, or an availability assumption drawn from a different site’s experience does not transfer to a new project without re-confirmation, because feed mineralogy, equipment configuration, and operating practice differ enough between sites that even a structurally similar duty can behave differently under test. The sizing basis a project submits should therefore rely on its own representative testwork and its own stated conditions, not on assumed equivalence with another installation.
When Porvoo or another equipment supplier reviews a sizing basis for quotation, the documented dry-solids demand, feed envelope, testwork conversion, operating duty, availability inputs, and continuity decision together form the information a capacity calculation and equipment offer can be checked against. Where any of these elements is missing, the resulting offer necessarily substitutes an assumption for project information, and that substitution is exactly where a stated capacity can diverge from what the installed equipment delivers under the project’s actual feed conditions. A related method for building part of this basis — translating daily slurry volume and solids concentration into a required filter press capacity — covers the calculation mechanics; the documentation task here is making sure every assumption that calculation depends on is written down and available for the supplier to confirm against, rather than left as an unstated default.
Preguntas frecuentes
Q: Can capacity figures from different filter proposals be compared directly?
A: Only when they use the same dry-solids demand, feed cases, testwork basis, and productive-availability assumptions. Ask each supplier to restate its offered capacity on that common basis and identify the cycle steps or interruptions excluded from productive time.
Q: Which feed condition should govern sizing when the concentrate varies?
A: Use a defined variability envelope and determine which representative case controls the required productive capacity; do not assume the average slurry volume is the governing case. Record the controlling feed properties and dry-solids duty so the proposed equipment can be checked against the same case.
Q: When can an apparently adequate capacity rating still leave a production shortfall?
A: A shortfall can arise when cleaning, cake discharge, maintenance, or other modeled interruptions reduce productive availability below the required dry-solids duty. Check when those interruptions occur, how much duty remains, and what production consequence follows during the gap.
Q: How should a project choose between standby filter capacity and buffer storage?
A: Compare the productive duty that remains during an outage with the amount and duration of feed that project-specific storage can hold. Choose the arrangement only after matching each option to the defined outage scenario and lost-production consequence; the two measures should not be treated as automatically equivalent.
Q: Does citing GB/T 30177.2-2024 establish the capacity of an offered vacuum filter?
A: No. The standard identifies a broad performance-testing scope for vacuum filters, but it does not by itself establish a supplier’s capacity, certification, or result for this project. Verify the offer against representative feed testwork, the selected filter technology, and disclosed scale-up and availability assumptions.