Operators running ceramic tile production lines often discover dosing problems late — during a recycling water quality check, a sedimentation tower audit, or when dewatering throughput drops unexpectedly after a glaze chemistry change. By that point, the misdiagnosis has already been baked into operating procedure: someone adjusted PAC dose to chase a turbidity number without first checking whether pH had drifted, or held a fixed c-PAM rate across shifts with different slip solids loads. The cost is not always visible immediately, but it accumulates in chemical waste, carryover fines in reuse water, inconsistent sludge cake moisture, and filter press cycles that no longer hit target. Getting dosing control right depends on understanding which variable dominates which treatment target, and in what order adjustments should happen. The sections below give you the control logic to make those calls on your own process rather than reacting to results after the fact.
Control pH before judging coagulant or polymer dose
When anionic surfactant removal is the treatment target, pH exerts a stronger influence on outcome than PAC dosage does. This is not a minor calibration detail — it means that adjusting PAC dose without first verifying pH position will consistently produce misleading results. If pH is above the effective operating window, increasing PAC dose may produce little observable improvement, and operators are likely to attribute the poor response to the wrong variable entirely.
The research-derived threshold for surfactant removal using PAC is pH below 6. This is a study condition, not a universal regulatory cutoff, and your wastewater matrix may shift that boundary. But the directional implication holds: pH must be stabilized as a prerequisite step before any coagulant dose adjustment is valid. An operator who skips this check and increases PAC dose to compensate is running a control experiment with two variables changing simultaneously, which makes it impossible to attribute the response correctly.
The downstream consequence of this misattribution tends to surface late. A process that appears to meet nominal dose compliance during initial commissioning can show inconsistent results during audit or across production shifts if pH variability has never been controlled. At that stage, the root cause has already been attributed to dose, and correcting it requires revisiting a decision that should have been treated as foundational. pH measurement per ISO 10523:2008 should be part of the routine operating record, not a parameter checked only when something is visibly wrong.
| Factor | p-value | Dose Adjustment Priority |
|---|---|---|
| pH | 0.775 | Control pH to <6 before adjusting PAC |
| PAC dosage | 1.22 | Adjust only after pH is below 6 |
A practical implication for operators: if turbidity or settling response varies between morning and afternoon shifts without a corresponding change in dose, check whether pH is drifting as production progresses. Glaze milling and surface treatment operations often introduce alkalinity or acid load at different points in the production cycle, and pH at the dosing inlet may not match what was measured at the start of shift.
Match PAM and PAC order to wastewater chemistry
The dominant chemical changes depending on which contaminant you are targeting. For COD removal, c-PAM has stronger influence than PAC. For anionic surfactant removal, PAC is the primary driver and c-PAM plays a secondary role. Running the same fixed dosing order and adjustment priority across both targets is a control failure that can silently underperform on one objective even when it appears to satisfy the other.
This creates a real operational friction when wastewater composition shifts — for example, when a glaze change increases surfactant load while COD stays within range. An operator calibrated to treat COD as the primary driver will adjust c-PAM first, which may leave surfactant removal inadequate because PAC was not the focus of adjustment. The correct response depends on identifying which contaminant is actually limiting treated water quality before deciding which chemical to move.
| Target Contaminant | More Influential Chemical (p-value) | Dosing Order Priority |
|---|---|---|
| COD | c-PAM (p=0.539) | Adjust c-PAM first, then PAC |
| Anionic surfactant | PAC (p=1.22) | Adjust PAC first, then c-PAM |
The p-value comparison in the table reflects findings from a specific study and should be treated as a planning criterion for dosing order logic rather than a universal sequencing rule. The practical takeaway is that operators should confirm the limiting contaminant — through jar testing or online monitoring — before assigning adjustment priority. For facilities that reuse treated water in glaze preparation or milling circuits, surfactant carryover may be the more consequential quality constraint, which shifts the dosing control emphasis toward PAC and pH management rather than polymer optimization.
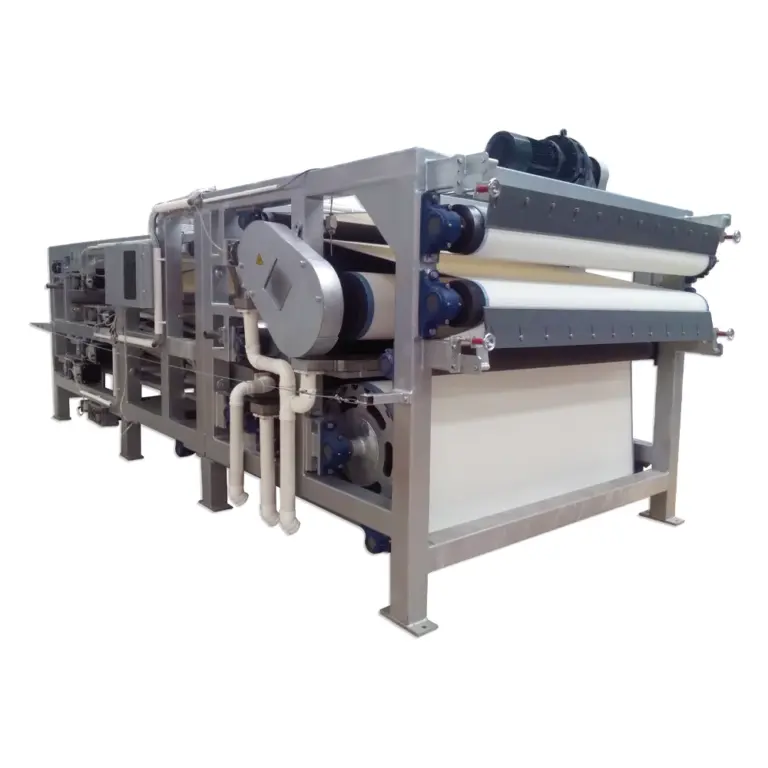
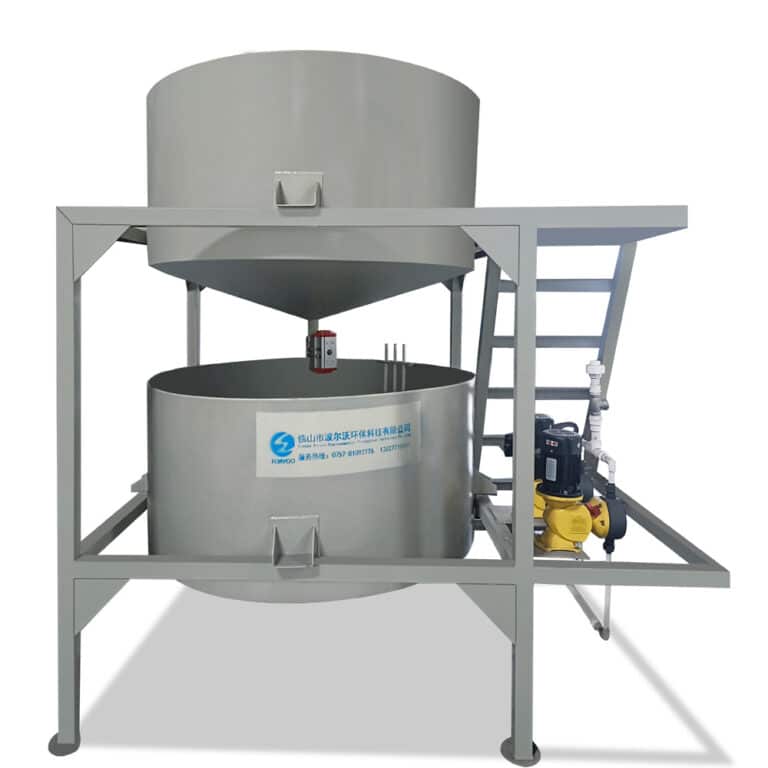
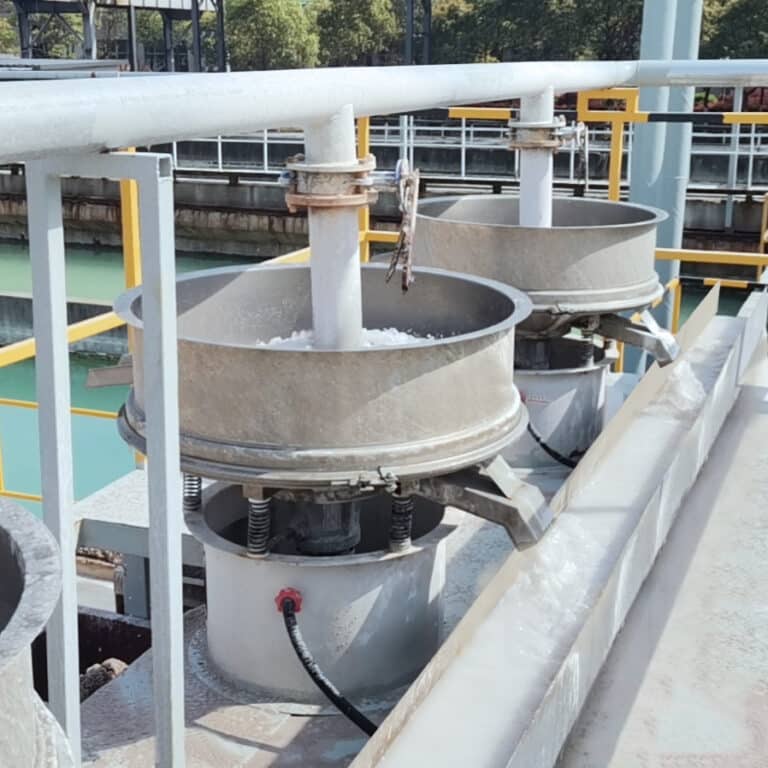
Give floc enough mixing without breaking it
Mixing energy is not a secondary parameter — it is the mechanism that determines whether chemicals dispersed into wastewater actually form settleable floc or remain as undissolved solids and weak aggregates. Both failure modes compromise reuse water quality, but they look different and have different causes.
Under-mixing leaves PAM incompletely hydrated. Undissolved polymer — sometimes called fish eyes — carries through to treated water as visible particulate or surface film. This is an overdosing symptom that occurs even at correct dose levels if dispersion is inadequate. Over-mixing breaks floc that has already formed, creating fine fragments that settle slowly or not at all. A jar test protocol of 200 rpm rapid mixing for 5 minutes, followed by 30 rpm slow mixing for 15 minutes and one hour of settling, provides a reproducible baseline for on-site validation. These are jar test conditions, not mandated plant-scale operating parameters, and scale-up to continuous plant operation will require validation against actual tank geometry and flow rates.
| Mixing Phase | Speed / Time | Risk if Insufficient | Risk if Excessive |
|---|---|---|---|
| Rapid mix | 200 rpm, 5 min | Undissolved polymer (fish eyes) | Floc breakage |
| Slow mix | 30 rpm, 15 min | Weak floc formation | Floc breakage |
The practical implication for automated systems is that dosing pump accuracy alone is not sufficient — dispersion and mixing consistency matter as much as chemical volume. Systems with automated mixing control reduce variability across shifts and reduce the likelihood that fish eyes reach the settling stage. If your sedimentation tower is seeing intermittent fine carryover that does not correlate with dose changes, mixing consistency is worth checking before assuming dose is the cause.
For facilities running PAM/PAC Intelligent Chemical Dosing System, verifying that mixing speed and sequence settings match validated jar test conditions is a commissioning checkpoint that should be documented before acceptance.
Use turbidity and settling response to tune dose
Turbidity measurement and settling observation serve as the primary verification tool for whether a dose adjustment is actually working — not as targets in themselves, but as real-time feedback that tells you whether to hold, increase, or pull back before committing a new dose setting to production operation. The distinction matters because a dose change that appears correct on paper may underperform against actual wastewater composition, and turbidity response is the fastest indicator that something is not working before dewatering and recycling systems downstream are affected.
Study conditions using PAC at 300 mg/L at pH 7 combined with c-PAM at 4.5 mg/L achieved 95.69% COD removal and 100% anionic surfactant removal. These are performance benchmarks that establish what the chemistry can achieve under controlled conditions, not guaranteed outcomes at those dose levels on a different wastewater matrix. Ceramic tile wastewater varies by production line, glaze batch, and shift intensity, and a dose setting that hits these benchmarks during jar testing may perform differently in continuous operation.
The verification check is straightforward: after any dose adjustment, run a settling observation before treating the change as stable. If a 30-minute settling column shows visible fines still suspended at the midpoint, the floc structure is likely insufficient — either dose is low, pH is outside range, or mixing energy was inadequate. Turbidity measurement per ISO 7027-1:2016 provides a reproducible monitoring method for this check, though the acceptable turbidity range for your reuse application will depend on downstream quality requirements, not on a universal standard cutoff. If turbidity after settling does not improve following a dose increase, pH should be checked before adding more chemical.
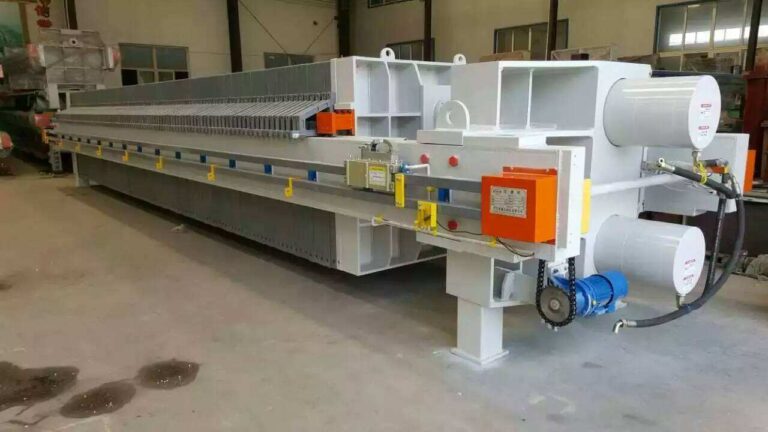
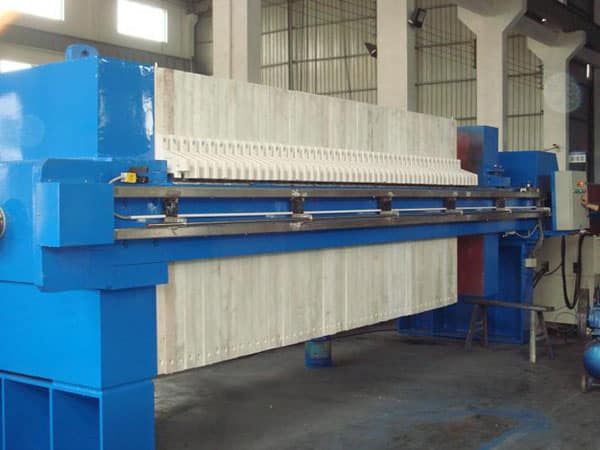
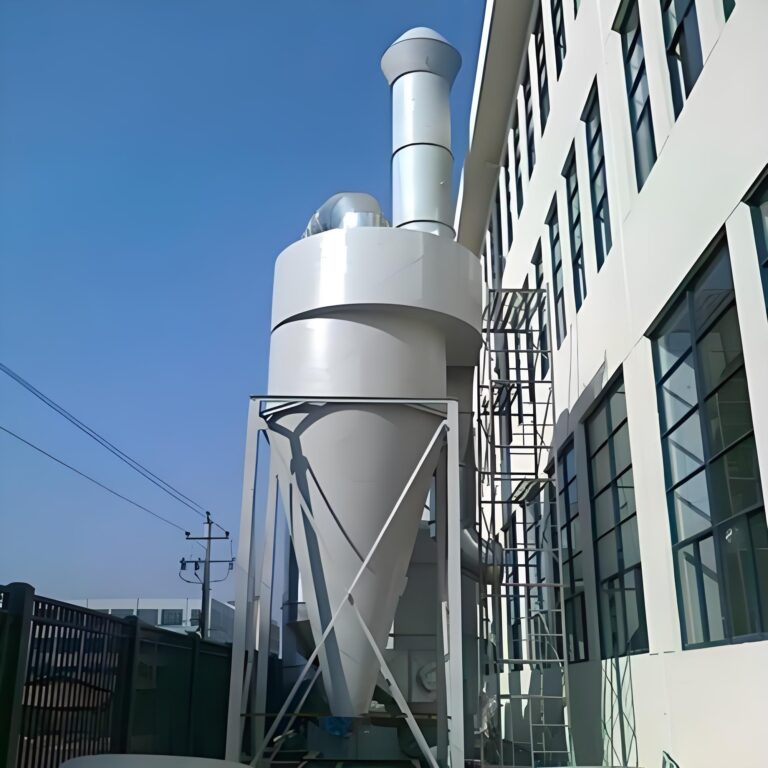
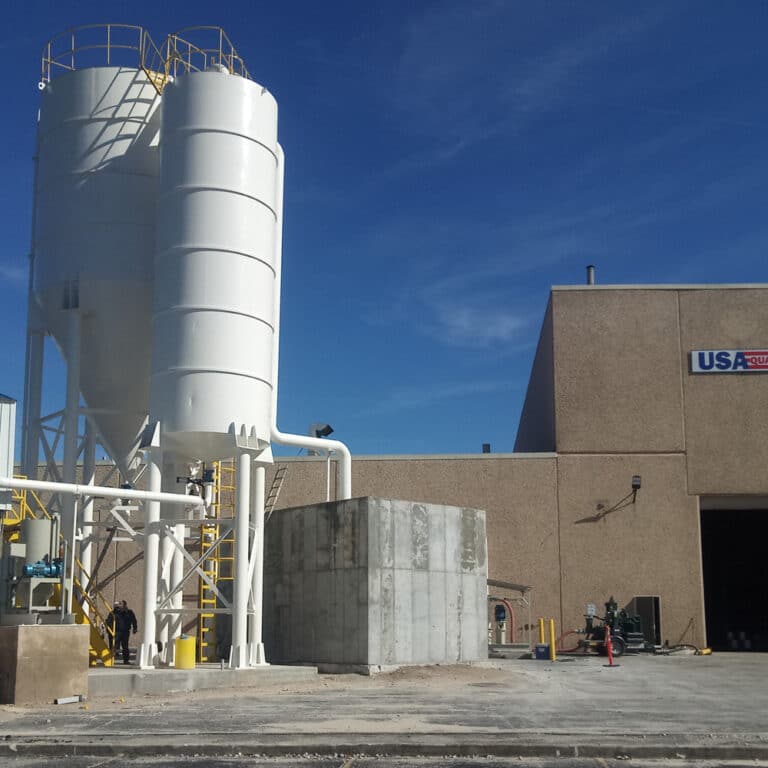
Watch sludge volume and dewatering load after dose changes
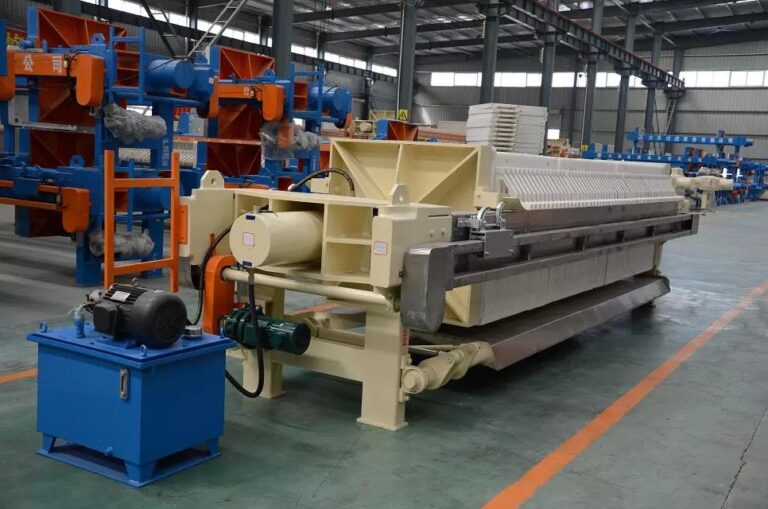
PAC generally produces lower sludge volumes than traditional aluminum sulfate or ferric coagulants, which reduces loading on downstream dewatering equipment. This advantage is real, but it is not fixed — it changes as dose increases. Treating sludge volume as a static characteristic of PAC, independent of operating dose, leads to underestimating dewatering capacity needs when dosing is pushed higher to handle heavier solids loads or challenging wastewater batches.
The directional risk is that a dose increase justified by treatment performance creates an unplanned increase in sludge volume that the downstream filter press cycle was not sized for. Sludge cake moisture content is the key performance metric here. Under defined filter press conditions, a target of ≤30% moisture content is a design figure for acceptable dewatering performance, not a regulatory discharge standard. When dose changes push sludge volume up or alter floc structure, moisture content often increases and cycle time extends. If cake moisture rises above target following a dose adjustment, it is worth checking whether the change in floc characteristics — not just the volume increase — is affecting press performance.
Sludge monitoring should be treated as part of the dose adjustment process rather than as a separate operation. Any time PAC or c-PAM dose is changed to address treatment performance, sludge volume and moisture content in the next press cycle should be logged and compared against the pre-adjustment baseline. This creates a feedback loop that catches dewatering load creep before it becomes a production bottleneck. For facilities using a Vertical Sedimentation Tower for Wastewater Recycling, settled sludge drawdown intervals may also need adjustment when dosing changes alter sedimentation rate or blanket depth.
Avoid overdosing that creates downstream carryover
Overdosing PAC or c-PAM does not produce a proportionally better result — it produces a different failure mode that appears in recycling water quality rather than at the point of chemical addition. This makes it easy to miss during dosing setup and validation, and difficult to diagnose when reuse water quality problems emerge later in the production loop.
Excess PAC leaves residual aluminum in treated water. A design figure commonly used as a carryover risk indicator is 0.2 mg/L residual aluminum — exceeding this threshold suggests PAC dose is above what the wastewater chemistry can consume through coagulation, and the excess is carrying forward into reuse circuits. Whether your local applicable standard matches this figure should be confirmed separately, but operationally, residual aluminum above this level is a signal to reduce PAC dose and recheck pH, since pH out of range can prevent coagulation from completing regardless of how much PAC is added. Excess c-PAM presents differently: undissolved polymer solids — fish eyes — carry into reuse water as visible particulate that can interfere with glaze preparation, surface treatment, or any downstream process sensitive to viscosity or coating uniformity.
| Chemical | Overdose Consequence | Acceptable Limit / Indicator |
|---|---|---|
| PAC | Residual aluminum carries into reuse water | <0.2 mg/L |
| PAM | Undissolved polymer (fish eyes) carries into reuse water | No visible fish eyes |
Smart dosing systems with real-time monitoring can reduce chemical consumption and improve dose precision, with some process implementations reporting 15–20% reduction in chemical waste. Treat that as a planning criterion for system justification rather than a guaranteed outcome — the actual benefit depends on how variable your current dosing is and how well it has been calibrated against actual wastewater conditions. The more relevant operational point is that overdosing is not a safe margin; it is a failure mode with deferred costs that surface downstream.
Set operating ranges instead of one fixed dose
A single fixed dose point is not a control strategy — it is a starting assumption that will underperform whenever wastewater chemistry shifts. Ceramic tile production lines change glaze batches, run different body formulations across shifts, and may receive wash water from multiple process steps with different solids and surfactant loads. A dose that was optimized for one condition becomes a source of variability when those inputs change, without any mechanism to detect or correct the drift.
Operating ranges derived from study conditions provide a more useful control framework. For anionic surfactant removal, PAC in the range of 200–350 mg/L is a reasonable starting band for site-specific optimization. For COD removal, PAC at 300 mg/L at pH 7 combined with c-PAM at 4.5 mg/L has demonstrated strong performance under controlled conditions. Both figures should be treated as starting points for jar testing on your specific wastewater, not as transferable specifications.
| Target Contaminant | Chemicals | Recommended Range / Condition |
|---|---|---|
| Anionic surfactant removal | PAC only | 200–350 mg/L |
| COD removal | PAC + c-PAM | PAC 300 mg/L at pH 7 + c-PAM 4.5 mg/L |
The important planning implication is that the range boundaries should be tied to your actual wastewater chemistry, not to a nameplate setting or a number carried over from another facility. Defining upper and lower dose limits for each contaminant target — and pairing those limits with the pH condition that makes them valid — gives operators a bounded decision space rather than a single number to hold regardless of conditions. When a jar test or online monitoring result falls outside expected turbidity or settling response, the range gives operators a structured path to adjustment rather than an open-ended troubleshooting problem.
For a more detailed framework on system design and operating logic, the Complete PAM/PAC Intelligent Chemical Dosing System Guide covers engineering considerations across a wider range of wastewater treatment applications.
The most durable control logic for ceramic tile wastewater dosing starts with pH stabilization as a prerequisite, assigns adjustment priority by contaminant target rather than by habit, and verifies every dose change through turbidity and settling response before treating it as settled operating practice. What looks like a dose problem is often a pH problem. What looks like a PAC problem is often a mixing or sequencing problem. And what looks like stable operation after commissioning may be slowly accumulating residual aluminum or polymer carryover that only becomes visible when reuse water quality is tested downstream.
Before finalizing operating ranges, confirm which contaminants are actually limiting reuse water quality for your specific downstream applications, whether your current pH monitoring captures shift-level drift, and whether your sludge dewatering cycle has been validated against the dose levels you intend to run rather than against an earlier baseline. Those three checks are where the difference between a dosing system that holds and one that requires constant intervention is usually determined.
Frequently Asked Questions
Q: What should operators do first after commissioning a new dosing system before locking in operating ranges?
A: Run jar tests on your actual wastewater — not on published benchmarks — before treating any dose figure as a fixed setting. Study conditions such as PAC 300 mg/L at pH 7 with c-PAM 4.5 mg/L reflect a controlled wastewater matrix that may differ meaningfully from your production line’s glaze chemistry, solids load, and surfactant profile. Until jar test results are validated against your specific inlet conditions, any dose number is an unverified starting assumption, not a calibrated control point.
Q: Does PAC and c-PAM dosing control logic still apply if the facility treats combined wastewater from multiple production lines rather than a single dedicated stream?
A: The same control principles apply, but the difficulty of applying them increases significantly. When wastewater from multiple lines is combined, the inlet chemistry can reflect different glaze batches, solids concentrations, and surfactant loads simultaneously, making it harder to isolate which contaminant is limiting performance at any given time. In that situation, pH stabilization becomes even more critical as a prerequisite step, and operating ranges should be derived from jar tests that deliberately sample worst-case combined inlet conditions rather than any single-line average.
Q: At what point does switching from PAC to a different coagulant make more sense than continuing to optimize PAC dose and pH?
A: PAC’s lower sludge volume and demonstrated performance on anionic surfactant and COD removal in ceramic tile wastewater give it a meaningful operational advantage over traditional aluminum sulfate or ferric coagulants in most production contexts. The threshold where that advantage erodes is when your wastewater consistently falls outside the pH range where PAC coagulation completes effectively, and pH correction costs or operational complexity outweigh the sludge volume and chemical efficiency benefits. If pH adjustment is already required as a routine step and residual aluminum remains elevated despite correct dosing, that is the point to evaluate whether a different coagulant chemistry better suits your inlet conditions.
Q: If turbidity after settling does not improve following both a dose increase and a pH correction, what is the most likely cause being overlooked?
A: Mixing consistency is the most likely overlooked variable. If pH is confirmed within range and dose is within the validated operating band but turbidity response remains flat or inconsistent, the floc formation mechanism itself may be compromised — either by under-mixing that leaves polymer incompletely hydrated, or by over-mixing that breaks aggregates before they can settle. Before adding more chemical, verify that rapid and slow mixing sequences match the conditions used during jar testing, and check whether mixing performance varies between shifts or tank loading levels. Treating this as a chemical problem when it is a mechanical dispersion problem will continue to produce poor turbidity results regardless of how dose or pH is adjusted.
Q: How should sludge dewatering capacity be factored into the decision to increase dose during a difficult production batch?
A: Sludge dewatering capacity should be evaluated before committing to a dose increase, not after the press cycle falls behind. A dose increase that improves coagulation performance will also increase sludge volume and can alter floc structure in ways that extend press cycle time and push cake moisture above the ≤30% target threshold. If the filter press is already operating near capacity, a dose increase during a high-solids batch may resolve the treatment problem while creating a dewatering bottleneck that is slower to correct. The practical check is to compare anticipated sludge volume at the proposed dose against available press capacity before adjusting, then log moisture content in the first press cycle after any dose change to catch the impact early rather than after multiple cycles have been affected.