Glaze wastewater in ceramics production rarely arrives at a steady rate. Spray-booth washdowns, tool-cleaning cycles, and batch-mixing drains create surging volumes that vary significantly across shifts and production sequences. When a batch ceramic membrane concentrator is sized against average daily volume alone, the unit looks adequate during normal production but becomes the bottleneck during peak discharge events—forcing operators into bypass routing or overflow decisions that expose both the process and the downstream treatment system. The core judgment required before specifying any ceramic membrane concentrator sizing is whether the unit, at its defined membrane area and buffer configuration, can handle peak feed volume within the available filtration window after accounting for cleaning downtime and feed variability.
Map daily and peak glaze wastewater generation
Average daily volume is a starting point, not a sizing basis. The critical number is the peak daily or shift volume, including surges from combined cleaning drains, line washdowns, and batch dump events that occur outside normal production rhythm. In glaze operations, these peaks can be substantially higher than the calculated daily average—and it is the peaks, not the average, that determine whether the concentrator and its upstream buffer will hold volume without overflowing.
The minimum data set needed to defend a sizing decision includes flow volume at the highest observed production rate, TSS concentration across different glaze formulations, particle size distribution measured before any settling or pre-treatment, and documented production schedule variability. Each of these inputs affects a different design variable: TSS drives fouling rate and maximum concentration factor; particle size governs pore size selection and backpulse strategy; and production schedule variability reveals the intermittent discharge patterns that create mismatch between wastewater generation and membrane operating windows. Measuring any of these at only one production condition understates the real operating range.
The following table identifies the key data points required for sizing and explains why each must be confirmed under actual production variability rather than assumed from design specifications.
| Punto de datos | Why It Matters for Sizing | Qué confirmar |
|---|---|---|
| Daily average wastewater volume | Defines the total permeate volume to process each day; undersizing the daily capacity will cause overflow or bypass | Recorded over multiple production cycles to capture true average, not just design minimum |
| Peak wastewater flow rate / volume | Determines the required buffer storage and membrane capacity during high-generation periods; peak data prevents undersizing | The highest measured daily or shift volume, including cleaning peak and batch dump events |
| Total Suspended Solids (TSS) concentration | Drives fouling rate, maximum concentration factor, and expected flux; missing TSS data leads to unrealistic flux assumptions | Sampled across different glaze formulations and production batches to reflect worst-case solids loading |
| Particle size distribution (PSD) | Determines membrane pore size selection and backpulse/cleaning strategy; affects long-term flux stability | Measured at representative process points, not just after settling or pre-treatment |
| Production schedule variability | Reveals intermittent discharge patterns that challenge steady-state filtration; influences buffer sizing and batch operating windows | Documented start-stop cycles, shift changes, and cleaning drains that create surging flows |
A common mistake is recording feed data during a stable production period and treating those numbers as representative. Shift-change drains, equipment cleaning cycles, and glaze colour changeovers generate short-duration, high-volume, high-solids discharges that may not appear in a one-week average. If those events are not captured in the characterisation dataset, the sizing will be optimistic in exactly the conditions that matter most.
Include cleaning downtime in membrane capacity
The membrane is not always filtering. Backpulse cycles, backwash sequences, and periodic chemical cleaning remove the unit from productive operation, and the daily filtration window available to the concentrator is whatever remains after those intervals are subtracted. Sizing that uses total operating hours as the filtration window—rather than net filtration hours—overestimates daily capacity and produces a unit that cannot clear its feed volume on days when cleaning demand is higher than expected.
Flux-based capacity calculations that ignore backpulse and cleaning downtime consistently overestimate what a given membrane area can process in a production day.
Flux performance also changes across a batch cycle. As solids accumulate on the membrane surface between cleaning events, permeate flux declines. The sustained flux over an entire batch cycle—accounting for the fouled condition as the concentration factor rises—is the number that should anchor capacity calculations, not the clean-membrane flux measured at the start of a fresh cycle. If only initial flux is used, the sizing will appear comfortable during the early portion of a batch and then fall short as the cycle progresses.
The table below maps the cleaning-related factors that reduce effective daily capacity and clarifies what each requires in terms of measurement or confirmation before the sizing is finalised.
| Factor | Impacto en el dimensionamiento | Qué hay que aclarar |
|---|---|---|
| Routine backpulse/backwash cycles | Reduces net filtration time per hour; flux-based sizing that ignores pulse downtime overestimates daily capacity | Frequency, duration, and permeate used per backpulse cycle from pilot data or supplier specifications |
| Chemical cleaning intervals | Periodic CIP removes fouling but takes the membrane offline; longer cycles or frequent cleaning shrink the available production window | Expected cleaning frequency at target concentration factor and worst-case solids load |
| Flux recovery between cleaning steps | If flux recovery is incomplete, cumulative capacity loss grows across batches; sizing must use realistic sustained flux, not clean-membrane flux | Measured flux profile across multiple batch cycles, not only initial clean-water flux |
| Net daily filtration window | Total available hours for filtration (production hours minus cleaning downtime) sets the throughput limit for any given membrane area | Daily operating schedule including maintenance breaks, shift handovers, and cleaning block-out times |
| Upstream storage buffer impact | Adequate upstream storage can decouple cleaning downtime from production; insufficient storage forces the membrane to process more volume in less time | Buffer tank capacity relative to peak wastewater generation during cleaning outages |
Chemical cleaning frequency is a particularly sensitive variable for glaze wastewater because high-solids, fine-particle feeds can accelerate irreversible fouling if the cleaning interval is extended. Where site-specific solids loading has not yet been characterised, any frequency estimate should be treated as a starting point that requires validation under real feed conditions—not as a fixed schedule that can be locked into the design without testing.
Balance membrane area against buffer tank volume
Once the net daily filtration window is established, the designer faces a capital allocation decision: whether to carry more membrane area, more upstream buffer storage, or some combination of both. Neither approach is categorically superior; the right balance depends on peak generation rate, available footprint, hold-time sensitivity, and the maximum concentration factor the membrane can sustain before fouling sharply increases.
More membrane area reduces the time required to process each batch and lowers the pressure on upstream storage during peak generation events. More buffer volume absorbs intermittent peaks at lower capital cost but introduces hold-time, sedimentation risk, and the possibility that settled solids will be resuspended unevenly into the next batch—affecting TSS consistency and fouling behaviour at the membrane. For glaze wastewater, which often contains fine particles that settle slowly but can cake and stratify if held for extended periods, buffer tank sizing should include an assessment of mixing requirements and the practical limit on hold-time before feed quality drifts enough to affect concentrator performance.
The trade-offs between these two approaches are summarised below.
| Enfoque de diseño | Ventaja | Trade-Off / Risk |
|---|---|---|
| Increase membrane area | Reduces batch processing time, lowers peak storage demand, and decreases risk of overflowing upstream tanks | Higher capital cost for membrane modules and supporting skid; may lead to under-utilised area during low-load periods |
| Increase buffer tank volume | Absorbs intermittent peak flows at lower capital cost, decouples generation from treatment schedule | Longer hold-time increases risk of sedimentation, mixing issues, and possible biological or odour problems; larger footprint and added tank maintenance |
The maximum concentration factor also has a direct bearing on this decision. As the concentration factor rises, retentate volume shrinks and the volume that must be stored or further treated decreases—but fouling rate increases. The usable concentration factor is a fouling-limited ceiling, not a fixed design output, and it must be confirmed through testing rather than assumed from datasheet values. If the concentration factor used in the sizing calculation is higher than what the actual feed will sustain, the retentate volume will be larger than planned, storage requirements will be underestimated, and the buffer tank sizing that looked adequate will be insufficient.
The maximum concentration factor is a fouling-limited operating boundary, not a guaranteed design output; using an optimistic value undersizes retentate storage and concentrate handling.
Protect production from batch overflow events
Batch overflow is not an abstract failure scenario—it is what happens when the concentrator cannot clear its feed volume within the available batch window and the upstream buffer runs out of capacity. The production consequence depends on what the overflow goes to: a contained emergency tank, a secondary treatment path, or, in a poorly designed system, an uncontrolled discharge point. None of these outcomes is recoverable without additional operator intervention, and the scheduling disruption cascades into subsequent batches.
The risk is not eliminated by sizing the membrane area conservatively. It is controlled by defining the peak feed volume with confidence, confirming the net daily filtration window after cleaning downtime, validating the maximum concentration factor, and ensuring that the buffer tank has enough working volume to absorb the difference between generation rate and processing rate during the slowest part of the batch cycle—typically the high-concentration end of the run, where flux is lowest.
Two conditions most reliably precede overflow events in batch ceramic membrane systems: the peak feed volume was estimated from average data rather than measured peak data, and the net filtration window was calculated from total operating hours without subtracting cleaning time. Both conditions are avoidable if the characterisation work is done before equipment is specified, not during commissioning. Discovering either condition after installation typically requires buffer tank additions, modified operating schedules, or reduced production throughput while the system is reworked—all of which carry direct cost and schedule implications.
Specify emergency routing and concentrate storage
Emergency routing and concentrate storage should be treated as design requirements, not contingency items to be resolved after the system is commissioned. The concentrate stream from a batch ceramic membrane concentrator reaches its highest solids loading at the end of the concentration cycle, and the volume that must be handled at that point—whether routed to a downstream thickener, sludge handling system, or temporary holding vessel—needs to be defined before membrane area and buffer tank sizing are finalised.
Emergency routing decisions made after commissioning are consistently more expensive and more disruptive than those integrated into the original design layout.
The concentrate storage volume required at any given site is a function of the maximum concentration factor, the daily feed volume, the downstream handling capacity, and the logistics of scheduled concentrate removal or further treatment. If downstream thickening or filter-press capacity operates on a fixed schedule that does not align with the concentrator’s batch cycle, concentrate must be held between cycles without allowing further settling or solidification that would make subsequent handling more difficult. This is a practical logistics question as much as a sizing question, and it requires coordination between the concentrator design and whatever follows it in the sludge handling chain.
Emergency routing capacity—whether a dedicated holding tank, a diversion valve to a secondary buffer, or a connection to an existing equalisation basin—should be sized to handle the maximum single-batch concentrate volume plus a margin that reflects realistic operator response time. Specifying this capacity without a defined peak concentrate volume, confirmed by the maximum concentration factor from pilot testing, is a design gap that typically becomes visible only when an unplanned event occurs.
Confirm sizing after feed variability testing
A sizing calculation based on characterisation data is a structured estimate. Pilot testing is the step that converts that estimate into a defensible design basis. The operating parameters that matter most for scale-up—sustained flux at design TSS levels, maximum achievable concentration factor, cleaning frequency and flux recovery, and the system’s behaviour under stop-start feed conditions—cannot be reliably predicted from steady-state theory alone when the feed is glaze wastewater with variable formulations and intermittent discharge patterns.
The table below defines the key parameters that pilot testing should validate and what each confirmation is intended to establish before the sizing is locked.
| Parameter to Verify | Pilot Testing Objective | Qué confirmar |
|---|---|---|
| Permeate flux at design TSS levels | Validate that stable flux can be maintained across the expected solids range, not only on clean feed | Acceptable flux range that meets daily volume target without exceeding fouling limits |
| Maximum achievable concentration factor | Identify the point at which fouling sharply increases, setting the minimum retentate volume for storage and further treatment | Final concentration factor before rapid flux decline, confirmed across multiple feed batches |
| Cleaning frequency and effectiveness | Determine whether backpulse and chemical cleaning cycles restore flux adequately under real feed variability | Measured flux recovery after each cleaning event and the trend over repeated batch cycles |
| Impact of flow variability on flux | Test how intermittent and peak flows affect hydrodynamic conditions and membrane performance | Flux stability and fouling rate under stop-start operation and peak feed surges, not only steady-state conditions |
| Long-term fouling rate | Project membrane replacement and maintenance needs after extended operation with variable glaze wastewater | Sustained flux decline rate over a representative multi-day trial with realistic cleaning intervals |
Feed variability is the condition most likely to invalidate a steady-state sizing assumption. Glaze wastewater changes composition between colour batches, cleaning events, and production sequence changes, and the membrane’s response to that variability—particularly the fouling rate during high-TSS peaks and the cleaning effectiveness after high-concentration batches—needs to be measured under conditions that reflect real production, not a controlled single-feed test. A pilot run conducted only on a representative mid-range feed sample may confirm the membrane technology is viable but leave the actual operating limits undefined.
Pilot testing should also be used to validate the cleaning protocol: whether backpulse frequency and duration are adequate to sustain target flux, whether chemical cleaning restores flux adequately after high-concentration batches, and how flux recovery trends across multiple cleaning cycles—not just after the first. Cumulative flux decline across repeated cycles affects the usable membrane life and the effective daily capacity that can be assumed in the sizing model.
Flux recovery confirmed after a single cleaning cycle does not represent sustained performance; the trend across repeated batch cycles is the figure that drives long-term capacity planning.
Before a ceramic membrane concentrator for glaze wastewater is specified, four things must be defined with measured data rather than calculated estimates: the peak daily feed volume under worst-case production and cleaning conditions, the full TSS and particle size range across all relevant glaze formulations, the net daily filtration window after cleaning downtime is subtracted, and the maximum concentration factor validated through pilot testing with real feed. Without all four, the sizing will carry an unknown margin of optimism that typically surfaces as scheduling instability, buffer overflow risk, or undersized concentrate storage after commissioning.
The balance between membrane area and buffer tank volume is a capital and operational risk decision that cannot be resolved on generic grounds. It depends on the site’s peak flow profile, acceptable hold-time for concentrated glaze wastewater, downstream sludge handling capacity, and the concentration factor the feed will actually sustain. Emergency routing and concentrate storage are not items to defer—their capacity requirements are fixed by the same pilot data that validates the membrane sizing, and integrating them into the original design layout is consistently less disruptive than adding them after installation.
Preguntas frecuentes
Q: Our facility has never measured peak wastewater flows—only average daily discharge is known. How do we start sizing a batch concentrator without that data?
A: Begin with a conservative peak estimate built from simultaneous worst-case events, such as all spray-booth washdowns and a colour changeover overlapping in the same shift, then confirm the number with temporary flow logging before equipment is specified. The sizing must be anchored to the highest credible volume, not the average, and field verification closes the data gap early enough to avoid oversizing or undersizing.
Q: Once pilot testing confirms the sizing parameters, what is the immediate next step before ordering the full-scale system?
A: Freeze a design basis document that locks the validated sustained flux, maximum achievable concentration factor, cleaning protocol, and peak feed volume, then convert that document into a performance specification the supplier must meet at commissioning. Without this step, pilot test results remain advisory rather than enforceable design inputs.
Q: At what TSS concentration or particle size does a batch ceramic membrane concentrator become technically impractical for glaze wastewater?
A: There is no single hard cut-off, but operations where TSS regularly exceeds 5% and the particle size distribution is heavily submicron—especially with sticky organic additives—often see sustained flux fall to uneconomic levels and cleaning frequency rise beyond what a batch schedule can absorb. The practical limit is feed-specific and can only be set after the maximum concentration factor and flux recovery are tested under real production variability, not from datasheet values.
Q: How does a batch ceramic membrane concentrator compare to a continuous membrane system for handling variable glaze wastewater flows?
A: A batch system matches intermittent glaze discharge patterns directly because it can be run in defined windows that follow cleaning drains and dump events, whereas a continuous system requires a steady feed and tends to become unstable with frequent starts, stops, and composition swings. The batch approach avoids the large equalization storage that a continuous system would need to smooth irregular generation.
Q: Is a batch ceramic membrane concentrator a cost-justified investment for a small ceramic studio with limited daily wastewater?
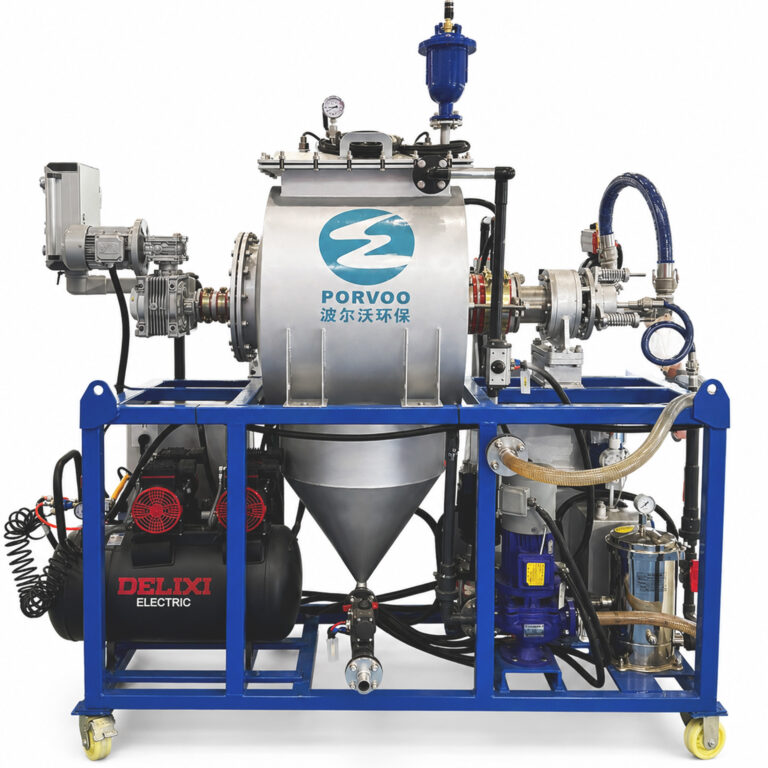
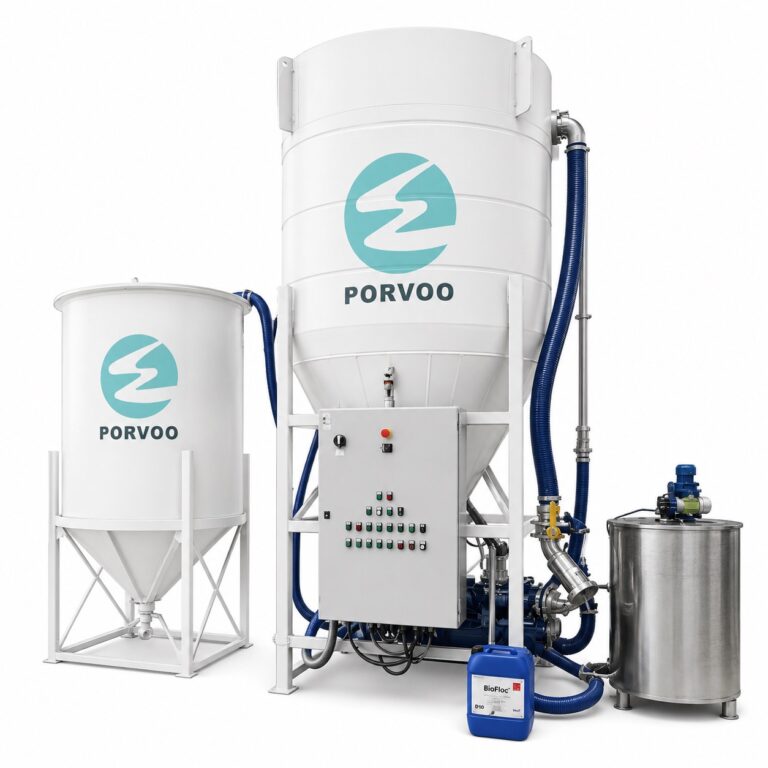
A: For operations generating less than 1–2 m³ per day, the capital and operating cost often lack a clear payback unless strict zero-discharge rules or high sludge disposal fees force volume reduction; simple settling and filter-press dewatering may be adequate. Larger industrial producers typically justify the investment through reduced sludge handling and water recovery, and Porvoo’s Rotary Ceramic Membrane Concentration System is engineered for commercial-scale duty, with pilot testing recommended to confirm viability for borderline volumes.