Raising polymer dose is often the first adjustment operators reach for when cake comes off wet or filtrate runs cloudy. The problem is that it frequently makes things worse in ways that take weeks to trace back to the chemical system: polymer deposits accumulate on belt cloth, wash cycles become more frequent, and return water carries excess polymer into the treatment loop — all while the underlying cause turns out to be pH conditioning that was never checked or a sludge feed rate running above the range where the dose was originally calibrated. The real cost is not just chemical spend; it is the compounding of maintenance burden, cloth replacement frequency, and hauling fees that a marginally drier cake might have offset. What the following sections address is where to look before touching the dose dial, how to read drainage and filtrate signals together, and where the financial logic of dryness optimization actually holds.
Define what good floc looks like for this sludge
Floc quality is the upstream constraint that every downstream parameter — drainage speed, cake solids, filtrate clarity — ultimately reflects. Before comparing dose levels, operators need a working target for what acceptable floc actually looks like on this feed, not a generic benchmark borrowed from another site.
A useful orientation range from controlled dewatering studies is a floc yield stress of 1–5 Pa, which corresponds to filtrate suspended solids in the range of 0.9–0.5 g/L. These figures should be treated as practical design-range targets derived from experimental conditions, not as universal thresholds or regulatory limits. Different sludge compositions — particularly mixed industrial feeds with variable organic loading or seasonal conductivity shifts — can produce acceptable dewatering performance outside this window or fail within it. What the range provides is a starting calibration point: floc that is too weak drains poorly and loses solids to filtrate; floc that is overdosed and rigid tends to crack under press pressure and resist clean cake discharge.
The practical implication for commissioning and process setup is that target floc strength should be verified against site-specific feed characteristics before dose optimization begins. Running jar tests or capillary suction time (CST) measurements against actual plant feed — not against synthetic sludge or a different production stream — gives the team a local reference point. Without it, dose adjustments are being made against an undefined standard, and it becomes difficult to distinguish a dosing problem from a feed-condition problem later.
Tune pH coagulant and polymer order before dose increases
The sequencing of chemical additions matters more than most initial optimization exercises account for. pH adjustment and coagulant dosing set the surface charge and particle aggregation conditions that polymer then has to work with. If those upstream conditions are misaligned, increasing polymer dose does not recover lost floc quality — it adds cost on top of a conditioning failure.
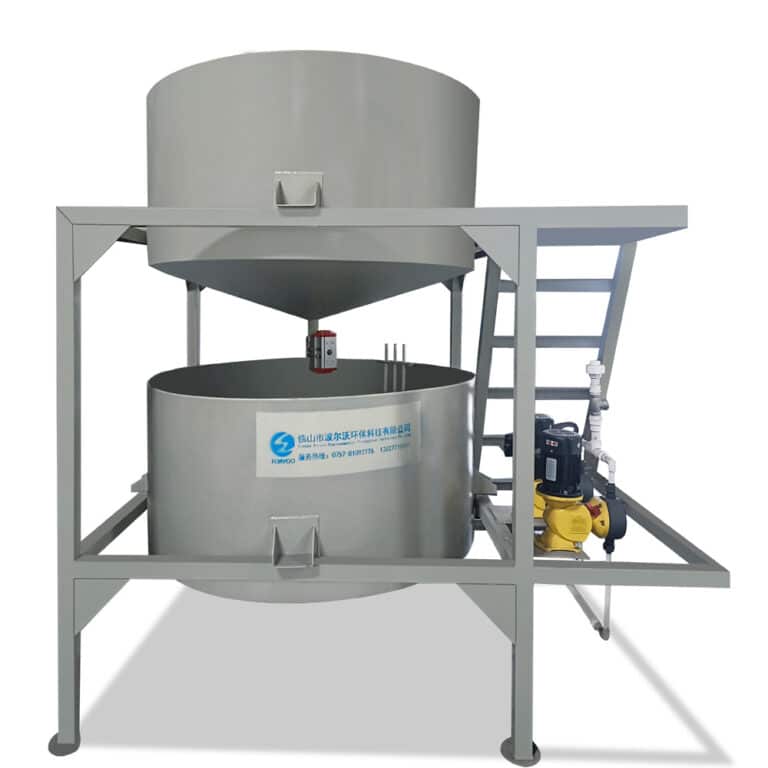
The more consequential adjustment lever is often polymer concentration rather than dosing rate. Concentration affects polymer chain extension and bridging efficiency in a way that volume-based rate changes do not replicate. If current performance is falling short, reviewing whether the dilution ratio at the make-up unit is producing the target concentration band should come before increasing the volumetric dose. This is not a subtle distinction: rate increases add chemical cost linearly, while concentration adjustments operate on the mechanism of flocculation itself.
The interaction between sludge feed rate and polymer dosing rate compounds this. These two parameters should be treated as jointly configured inputs, not independently tunable variables. A dosing rate calibrated at one feed flow produces a different polymer-to-solids ratio when feed rate shifts — and that shift in ratio can move the system from under-dosed to adequately conditioned, or from adequate to overdosed, without any change to the dosing pump setting. Teams that optimize dose at a fixed trial flow and then run the press at a different operating flow will often find that the trial results do not transfer cleanly. Establishing the dose-to-feed relationship across the expected feed flow range, rather than at a single point, is a more defensible configuration approach.
Compare drainage speed cake release and filtrate clarity
Not all operating parameters have equal influence on dewatering outcomes, and misreading which parameters matter most leads to effort applied in the wrong places. Controlled trial data on belt press performance points to sludge flow rate as the dominant variable for filtrate suspended solids — a finding supported by ANOVA at p = 0.0025, indicating that feed rate control deserves more operator attention than it typically receives relative to dosing adjustments. Linear screen speed, by contrast, is the parameter most significantly linked to cake solids content, while belt speed alone shows no statistically meaningful effect on either output in the same conditions.
| Operating Parameter | Effect on Cake Dryness | Effect on Filtrate Clarity | Importância |
|---|---|---|---|
| Sludge flow rate | Not significant for cake solids | Most influential parameter for filtrate suspended solids | p=0.0025 (ANOVA) |
| Linear screen speed | Significantly affects cake solids | Not directly reported | p<0.05 |
| Velocidade da correia | No significant effect | No significant effect | Not significant |
| Expected range (overall) | Cake solids 10.39–14.26% | Filtrate solids <0.5 g/L in 58% of trials | - |
What the table implies operationally is a two-lever priority structure: manage feed rate to protect filtrate clarity and solids capture; adjust linear screen speed to influence cake dryness. Belt speed can be used for throughput management without expecting it to change dewatering quality. The 10.39–14.26% cake solids range reflects attainable performance under typical conditions in these trials — one run exceeded 14%, but that should not be treated as a reliable upper target without replicating the specific conditions that produced it. Similarly, achieving filtrate suspended solids below 0.5 g/L — attained in 58% of trial runs — is a reasonable operational target, but not a guaranteed outcome under all feed and polymer conditions. Framing internal acceptance criteria around this attainment rate is more defensible than treating 0.5 g/L as a fixed specification.
Watch for overdosing that blinds cloth or dirties return water
Overdosing polymer does not simply reduce return on chemical spend — it creates a maintenance failure mode that compounds over time. Excess polymer that does not bind to sludge particles deposits on belt cloth, progressively reducing drainage capacity in a way that looks like a general performance decline rather than a specific chemical problem.
| Risk | Por que é importante | What to Monitor |
|---|---|---|
| Polymer deposits on belts from overdosing | Leads to cloth blinding, requires high-pressure washing; increases maintenance cost and downtime | Belt cleanliness after cycles, frequency of wash cycles needed |
| Inconsistent dosing from manual visual checks | Frequent under- and over-dosing errors reduce dewatering efficiency and increase chemical waste | Variation in effluent quality, frequency and direction of manual adjustments |
The cloth blinding pattern is operationally expensive because the corrective response — high-pressure belt washing — increases water consumption, cycle downtime, and cloth wear simultaneously. If overdosing continues, the wash frequency required to maintain drainage rates may eliminate the throughput gain that the higher dose was intended to produce. What makes this failure mode persistent is that it is self-reinforcing: blinded cloth drains more slowly, operators interpret that as underperformance, and the instinct is to increase dose further rather than to inspect and clean the cloth first.
The dosing error risk from manual visual effluent assessment is the upstream cause that enables this cycle. Visual turbidity judgment at the operator level is not a reliable control mechanism for polymer dosing. The direction and magnitude of manual adjustments vary between operators and shifts, which means that a dose range set during trials will drift in practice unless the operating range is narrow enough to hold without relying on visual judgment calls. Integrating inline turbidity monitoring referenced against a method like ISO 7027-1:2016 — or automating dose feedback through a system like the Sistema inteligente de dosagem de produtos químicos PAM/PAC — reduces this drift in ways that manual protocols cannot reliably match over a full operating week.
Put chemical cost beside hauling and cycle-time savings
Dewatering decisions are often evaluated on chemical cost alone, which systematically underweights the downstream savings that drier cake produces. Sludge handling typically accounts for 40–60% of total plant operating costs — a share large enough that even moderate improvements in cake dryness produce financial returns that dwarf the polymer cost difference.
| Fator de custo | Typical Value / Impact | Financial Implication |
|---|---|---|
| Sludge handling share of plant OPEX | 40–60% | Dewatering decisions heavily influence total operating costs |
| Volume reduction from mechanical dewatering | 70–80% | Directly reduces hauling and disposal fees |
| Cake water content reduction | Each 1% reduction saves ~$100k/year | Small dryness improvements yield significant annual savings |
The $100,000 per 1% reduction in cake water content figure is a planning-level benchmark from industry data, not a site-specific projection. Its role in the analysis is to establish the financial logic: the range of savings from a one-percentage-point dryness improvement is large relative to the polymer cost increment required to achieve it, provided the dose increase is actually producing drier cake rather than just adding chemical loading that returns in the filtrate. Mechanical dewatering’s 70–80% volume reduction effect compounds this logic — the base from which hauling fees are calculated shrinks substantially before any optimization is applied.
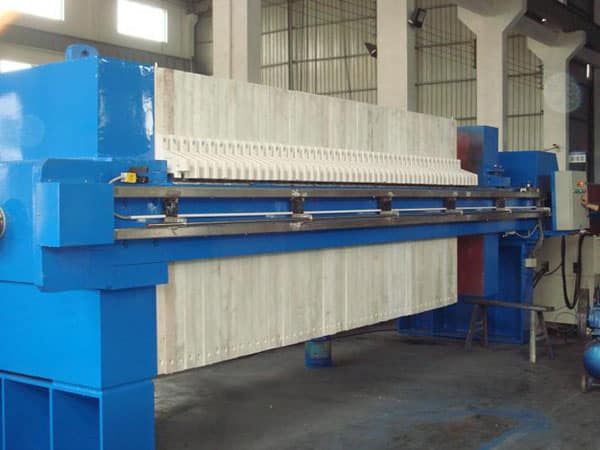
Where this trade-off calculation tends to go wrong is in excluding belt maintenance costs from the chemical cost side of the ledger. If a dose increase that improves cake solids by 1% also doubles wash cycle frequency, the cloth wear, water consumption, and downtime costs may consume a significant fraction of the hauling savings. A complete cost comparison needs to include chemical cost, cloth replacement interval, wash water volume, and press availability — not just polymer spend and disposal fees. For facilities using a filtro prensa de correia, cloth lifecycle and wash cycle frequency are often the operating variables with the most leverage on total dewatering cost once a stable dose is established.
Re-test when feed source or production mix changes
Static dose settings developed against one feed profile will drift out of calibration when production mix or influent source changes. This is not a generic observation about process variability — it follows directly from the demonstrated interaction between sludge feed rate and polymer dose. Because these two parameters need to be optimized jointly, a feed composition shift that changes sludge solids concentration, viscosity, or particle size distribution effectively moves the system to a different point on the dose-to-feed response surface. The dose that was optimal before may now be overdosing or underdosing against a different sludge.
The practical trigger for re-evaluation is any meaningful change in feed source, production blend, upstream treatment chemistry, or seasonal influent conditions. This should be treated as a routine performance-maintenance check rather than a commissioning-phase task. Waiting for dewatering performance to degrade visibly before re-testing means the operation has already accumulated reject cake, dirty filtrate, or excess polymer spend before the problem is recognized. Documenting the feed conditions and corresponding dose settings from each optimization exercise — even informally — gives operators a reference map for detecting when current performance has drifted from a previously calibrated state. This documentation is also the starting point for a defensible re-evaluation rather than a blind re-optimization from scratch. For a detailed comparison of how dose settings and polymer consumption interact across press configurations, the belt filter press polymer consumption analysis provides useful context on how feed-to-dose relationships differ between system types.
Set a dose range operators can actually control
A dose range that performs well during supervised trials often deteriorates in daily operation because the operating window is too wide for operators to hold without real-time feedback. The goal at the end of optimization is not a single target dose — it is a defined range with clear priority parameters that operators can manage with available controls.
| Parâmetro | Recommended Operating Range | Impacto no desempenho |
|---|---|---|
| Polymer concentration | 0.2–0.3% | Affects floc strength and drainage; adjust concentration before dosing rate |
| Polymer dosing rate | 0.4–0.6 m³/h | Interacts with sludge feed rate; optimize together |
| Sludge feed rate | 40–60 m³/h | Most influential parameter for filtrate clarity and solids capture |
| Velocidade da correia | 40–50 Hz | No significant effect on cake dryness; adjust for throughput |
| Linear screen speed | 60–70 Hz | Significantly impacts cake solids; key to dryness control |
The priority logic that the table reflects is this: sludge feed rate and linear screen speed have the most direct and statistically supported influence on the two main dewatering outputs — filtrate clarity and cake solids respectively. Operators should treat these two settings as the primary control levers and adjust polymer concentration before adjusting dosing rate when chemical changes are needed. Belt speed is a throughput variable, not a quality variable, and should not be used to chase dryness targets.
The concentration range of 0.2–0.3%, dosing rate of 0.4–0.6 m³/h, feed rate of 40–60 m³/h, and screen speed of 60–70 Hz are recommended operating ranges derived from specific trial conditions. They provide a practical starting framework, but they require validation against site feed characteristics before being adopted as standing operating parameters. The most important constraint on this framework is that it only holds if the operating range is narrow enough for operators to maintain without relying on visual effluent judgment. A range that looks controllable on paper but requires constant subjective adjustment in practice will produce the same chronic dosing errors as having no defined range at all.
The balance between polymer consumption and cake dryness is not a single-variable optimization. The concrete implication of the evidence here is that sludge feed rate and linear screen speed deserve the same systematic attention as dose when dewatering performance is being evaluated or corrected. Chemical cost comparisons that exclude cloth maintenance, wash water, and press availability are incomplete and will consistently make dose increases look more attractive than they are in practice.
Before committing to a dose range or a polymer specification for a new or modified installation, the priority checks are: confirm that pH conditioning and coagulant sequencing are correctly set for this feed; establish the dose-to-feed relationship across the actual operating flow range rather than at a single trial point; and define an operating window narrow enough that operators can hold it without manual visual assessment as the primary control signal. When feed source or production mix changes, treat those settings as requiring re-verification — not as a safe default carried forward from a different operating period.
Perguntas frequentes
Q: Does this optimization approach still apply if the sludge feed contains a highly variable mix of industrial and municipal streams?
A: Variable mixed feeds require more frequent re-calibration rather than a different approach, but the method’s reliability decreases if feed composition shifts are large and unpredictable. The dose-to-feed relationship established during trials is tied to specific sludge characteristics — solids concentration, viscosity, and particle size. When a mixed feed swings significantly in any of these properties between shifts or production cycles, the calibrated dose range can move from optimal to overdosed or underdosed without any change to pump settings. For highly variable feeds, the practical answer is to shorten the re-evaluation interval and log feed conditions alongside dose settings so that known composition states can be matched to previously validated settings rather than re-optimized from scratch each time.
Q: After locking in a stable dose range from trials, what is the first operational step before running the press at full throughput?
A: Verify that the dose-to-feed relationship holds across the full expected feed flow range before committing to full throughput — not just at the trial flow point. Dose rates calibrated at a single feed rate will produce a different polymer-to-solids ratio at higher or lower flows, which can shift the system into overdosing or underdosing territory as soon as throughput changes. Running the press incrementally through the planned feed rate range while monitoring filtrate suspended solids and cake discharge quality is the practical confirmation step. Only once the dose tracks consistently across that range should the settings be written into standing operating parameters.
Q: At what point does investing in automated dose control make more financial sense than tightening manual operating procedures?
A: Automated dose feedback becomes financially justified when manual visual assessment is the primary control signal and the operation runs across multiple shifts with different operators. Manual visual turbidity judgment introduces directional and magnitude errors that compound across a full operating week, causing the actual dose to drift outside the calibrated range in ways that are difficult to detect until performance has already degraded. The cost case for automation is strongest where cloth replacement frequency is high, wash cycles are frequent, or return water quality is a compliance concern — because those are the measurable costs that chronic dosing drift produces. Tighter manual procedures can reduce drift but cannot eliminate the inter-operator variability that makes the dose range unstable over time.
Q: Is a 1% improvement in cake dryness actually achievable without increasing polymer dose, or does it always require more chemical spend?
A: A 1% improvement in cake solids is achievable through mechanical parameter adjustments alone in many cases, specifically by reducing sludge feed rate or increasing linear screen speed, both of which have statistically significant effects on cake dryness independent of dose. The trial data shows that linear screen speed is the parameter most directly linked to cake solids content, while belt speed shows no meaningful effect. This means operators can pursue dryness improvement through equipment settings before touching chemical spend — and should do so, because a dose increase layered on top of a suboptimal screen speed setting adds chemical cost without addressing the more influential variable. Whether the specific 1% target is achievable without additional polymer depends on how close current settings are to the boundaries of the mechanical operating range.
Q: What is a realistic upper limit for cake dryness that this type of dewatering configuration should be designed around?
A: A practical upper planning target is 14% cake solids, with 10.39–14.26% as the achievable range under typical operating conditions based on controlled trial data. Only one trial run exceeded 14%, meaning that setting internal targets or disposal contracts around values above this range introduces delivery risk that the evidence does not support. Designing around the mid-range of 12–13% provides operational headroom while remaining consistent with what the equipment and chemical configuration can reliably produce. If disposal contracts or incineration requirements specify dryness targets above this range, a different dewatering technology or thermal step may need to be evaluated alongside belt press optimization rather than treating higher chemical dosing as the path to reaching them.
Conteúdo relacionado:
- Principais fabricantes de filtros cerâmicos a vácuo em 2025
- Os 10 principais fabricantes de filtros de disco a vácuo em 2025
- Principais fabricantes de filtros de disco de cerâmica em 2025
- Aumente a eficiência do sistema de filtragem a vácuo
- Principais equipamentos de separação sólido-líquido para 2025
- Tecnologia de filtragem com eficiência energética: Guia 2025